HSBC 2010 Annual Report Download - page 77
Download and view the complete annual report
Please find page 77 of the 2010 HSBC annual report below. You can navigate through the pages in the report by either clicking on the pages listed below, or by using the keyword search tool below to find specific information within the annual report.-
 1
1 -
2
-
3
-
4
-
5
-
6
-
7
-
8
-
9
-
10
-
11
-
12
-
13
-
14
-
15
-
16
-
17
-
18
-
19
-
20
-
21
-
22
-
23
-
24
-
25
-
26
-
27
-
28
-
29
-
30
-
31
-
32
-
33
-
34
-
35
-
36
-
37
-
38
-
39
-
40
-
41
-
42
-
43
-
44
-
45
-
46
-
47
-
48
-
49
-
50
-
51
-
52
-
53
-
54
-
55
-
56
-
57
-
58
-
59
-
60
-
61
-
62
-
63
-
64
-
65
-
66
-
 67
67 -
 68
68 -
 69
69 -
 70
70 -
 71
71 -
 72
72 -
 73
73 -
 74
74 -
 75
75 -
 76
76 -
 77
77 -
 78
78 -
 79
79 -
 80
80 -
 81
81 -
 82
82 -
 83
83 -
 84
84 -
 85
85 -
 86
86 -
 87
87 -
88
-
89
-
90
-
91
-
92
-
93
-
94
-
95
-
96
-
97
-
98
-
99
-
100
-
101
-
102
-
103
-
104
-
105
-
106
-
107
-
108
-
109
-
110
-
111
-
112
-
113
-
114
-
115
-
116
-
117
-
118
-
119
-
120
-
121
-
122
-
123
-
124
-
125
-
126
-
127
-
128
-
129
-
130
-
131
-
132
-
133
-
134
-
135
-
136
-
137
-
138
-
139
-
140
-
141
-
142
-
143
-
144
-
145
-
146
-
147
-
148
-
149
-
150
-
151
-
152
-
153
-
154
-
155
-
156
-
157
-
158
-
159
-
160
-
161
-
162
-
163
-
164
-
165
-
166
-
167
-
168
-
169
-
170
-
171
-
172
-
173
-
174
-
175
-
176
-
177
-
178
-
179
-
180
-
181
-
182
-
183
-
184
-
185
-
186
-
187
-
188
-
189
-
190
-
191
-
192
-
193
-
194
-
195
-
196
-
197
-
198
-
199
-
200
-
201
-
202
-
203
-
204
-
205
-
206
-
207
-
208
-
209
-
210
-
211
-
212
-
213
-
214
-
215
-
216
-
217
-
218
-
219
-
220
-
221
-
222
-
223
-
224
-
225
-
226
-
227
-
228
-
229
-
230
-
231
-
232
-
233
-
234
-
235
-
236
-
237
-
238
-
239
-
240
-
241
-
242
-
243
-
244
-
245
-
246
-
247
-
248
-
249
-
250
-
251
-
252
-
253
-
254
-
255
-
256
-
257
-
258
-
259
-
260
-
261
-
262
-
263
-
264
-
265
-
266
-
267
-
268
-
269
-
270
-
271
-
272
-
273
-
274
-
275
-
276
-
277
-
278
-
279
-
280
-
281
-
282
-
283
-
284
-
285
-
286
-
287
-
288
-
289
-
290
-
291
-
292
-
293
-
294
-
295
-
296
-
297
-
298
-
299
-
300
-
301
-
302
-
303
-
304
-
305
-
306
-
307
-
308
-
309
-
310
-
311
-
312
-
313
-
314
-
315
-
316
-
317
-
318
-
319
-
320
-
321
-
322
-
323
-
324
-
325
-
326
-
327
-
328
-
329
-
330
-
331
-
332
-
333
-
334
-
335
-
336
-
337
-
338
-
339
-
340
-
341
-
342
-
343
-
344
-
345
-
346
-
347
-
348
-
349
-
350
-
351
-
352
-
353
-
354
-
355
-
356
-
357
-
358
-
359
-
360
-
361
-
362
-
363
-
364
-
365
-
366
-
367
-
368
-
369
-
370
-
371
-
372
-
373
-
374
-
375
-
376
-
377
-
378
-
379
-
380
-
381
-
382
-
383
-
384
-
385
-
386
-
387
-
388
-
389
-
390
-
391
-
392
-
393
-
394
-
395
-
396
 |
 |

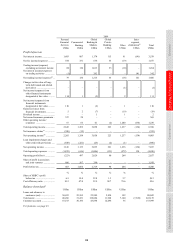
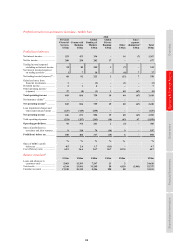
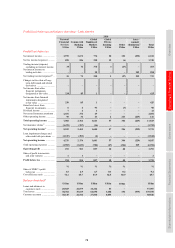
75
Overview Operating & Financial Review Governance Financial Statements Shareholder Information
2009
Personal
Financial
Services
US$m
Commercial
Banking
US$m
Global
Banking &
Markets
US$m
Global
Private
Banking
US$m
Other
US$m
Inter-
segment
elimination56
US$m
Total
US$m
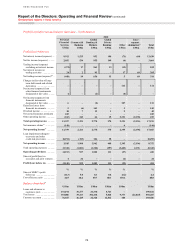
Profit/(loss) before tax
Net interest income/(expense) .... 11,244 1,391 999 178 (84) (58) 13,670
Net fee income ............................ 3,174 453 1,045 142 3 – 4,817
Trading income/(expense)
excluding net interest income 257 (10) (179) (3) (30) – 35
Net interest income/(expense)
on trading activities ................ 60 3 175 (1) 1 58 296
Net trading income/(expense)49 .. 317 (7) (4) (4) (29) 58 331
Changes in fair value of long-
term debt issued and related
derivatives .............................. – – – – (3,497) – (3,497)
Net income from other financial
instruments designated at
fair value ................................. – – – – 1 – 1
Net expense from financial
instruments designated
at fair value ............................. – – – – (3,496) – (3,496)
Gains less losses from financial
investments ............................. 16 3 277 – – – 296
Dividend income ......................... 21 5 27 2 (2) – 53
Net earned insurance premiums . 309 – – – – – 309
Other operating income .............. 9 162 317 11 1,828 (1,761) 566
Total operating income/(expense) 15,090 2,007 2,661 329 (1,780) (1,761) 16,546
Net insurance claims57 ................ (241) – – – – – (241)
Net operating income/
(expense)46 .............................. 14,849 2,007 2,661 329 (1,780) (1,761) 16,305
Loan impairment charges and
other credit risk provisions ..... (14,424) (519) (621) (98) (2) – (15,664)
Net operating income/
(expense) ................................ 425 1,488 2,040 231 (1,782) (1,761) 641
Total operating expenses ............ (5,651) (958) (1,328) (281) (1,934) 1,761 (8,391)
Operating profit/(loss) ................ (5,226) 530 712 (50) (3,716) – (7,750)
Share of profit/(loss) in
associates and joint ventures .. – 13 – – (1) – 12
Profit/(loss) before tax ................ (5,226) 543 712 (50) (3,717) – (7,738)
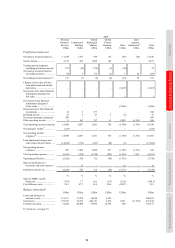
% % % % % %
Share of HSBC’s profit
before tax ................................ (73.8) 7.7 10.1 (0.7) (52.6) (109.3)
Cost efficiency ratio ................... 38.1 47.7 49.9 85.4 (108.7) 51.5
Balance sheet data45
US$m US$m US$m US$m US$m US$m
Loans and advances to
customers (net) ....................... 151,671 31,292 18,654 5,236 – 206,853
Total assets ................................. 179,597 38,232 260,131 6,572 2,071 (11,589) 475,014
Customer accounts ...................... 74,228 42,900 19,095 12,834 100 149,157
For footnotes, see page 83.