HSBC 2010 Annual Report Download - page 339
Download and view the complete annual report
Please find page 339 of the 2010 HSBC annual report below. You can navigate through the pages in the report by either clicking on the pages listed below, or by using the keyword search tool below to find specific information within the annual report.-
 1
1 -
2
-
3
-
4
-
5
-
6
-
7
-
8
-
9
-
10
-
11
-
12
-
13
-
14
-
15
-
16
-
17
-
18
-
19
-
20
-
21
-
22
-
23
-
24
-
25
-
26
-
27
-
28
-
29
-
30
-
31
-
32
-
33
-
34
-
35
-
36
-
37
-
38
-
39
-
40
-
41
-
42
-
43
-
44
-
45
-
46
-
47
-
48
-
49
-
50
-
51
-
52
-
53
-
54
-
55
-
56
-
57
-
58
-
59
-
60
-
61
-
62
-
63
-
64
-
65
-
66
-
67
-
68
-
69
-
70
-
71
-
72
-
73
-
74
-
75
-
76
-
77
-
78
-
79
-
80
-
81
-
82
-
83
-
84
-
85
-
86
-
87
-
88
-
89
-
90
-
91
-
92
-
93
-
94
-
95
-
96
-
97
-
98
-
99
-
100
-
101
-
102
-
103
-
104
-
105
-
106
-
107
-
108
-
109
-
110
-
111
-
112
-
113
-
114
-
115
-
116
-
117
-
118
-
119
-
120
-
121
-
122
-
123
-
124
-
125
-
126
-
127
-
128
-
129
-
130
-
131
-
132
-
133
-
134
-
135
-
136
-
137
-
138
-
139
-
140
-
141
-
142
-
143
-
144
-
145
-
146
-
147
-
148
-
149
-
150
-
151
-
152
-
153
-
154
-
155
-
156
-
157
-
158
-
159
-
160
-
161
-
162
-
163
-
164
-
165
-
166
-
167
-
168
-
169
-
170
-
171
-
172
-
173
-
174
-
175
-
176
-
177
-
178
-
179
-
180
-
181
-
182
-
183
-
184
-
185
-
186
-
187
-
188
-
189
-
190
-
191
-
192
-
193
-
194
-
195
-
196
-
197
-
198
-
199
-
200
-
201
-
202
-
203
-
204
-
205
-
206
-
207
-
208
-
209
-
210
-
211
-
212
-
213
-
214
-
215
-
216
-
217
-
218
-
219
-
220
-
221
-
222
-
223
-
224
-
225
-
226
-
227
-
228
-
229
-
230
-
231
-
232
-
233
-
234
-
235
-
236
-
237
-
238
-
239
-
240
-
241
-
242
-
243
-
244
-
245
-
246
-
247
-
248
-
249
-
250
-
251
-
252
-
253
-
254
-
255
-
256
-
257
-
258
-
259
-
260
-
261
-
262
-
263
-
264
-
265
-
266
-
267
-
268
-
269
-
270
-
271
-
272
-
273
-
274
-
275
-
276
-
277
-
278
-
279
-
280
-
281
-
282
-
283
-
284
-
285
-
286
-
287
-
288
-
289
-
290
-
291
-
292
-
293
-
294
-
295
-
296
-
297
-
298
-
299
-
300
-
301
-
302
-
303
-
304
-
305
-
306
-
307
-
308
-
309
-
310
-
311
-
312
-
313
-
314
-
315
-
316
-
317
-
318
-
319
-
320
-
321
-
322
-
323
-
324
-
325
-
326
-
327
-
328
-
 329
329 -
 330
330 -
 331
331 -
 332
332 -
 333
333 -
 334
334 -
 335
335 -
 336
336 -
 337
337 -
 338
338 -
 339
339 -
 340
340 -
 341
341 -
 342
342 -
 343
343 -
 344
344 -
 345
345 -
 346
346 -
 347
347 -
 348
348 -
 349
349 -
350
-
351
-
352
-
353
-
354
-
355
-
356
-
357
-
358
-
359
-
360
-
361
-
362
-
363
-
364
-
365
-
366
-
367
-
368
-
369
-
370
-
371
-
372
-
373
-
374
-
375
-
376
-
377
-
378
-
379
-
380
-
381
-
382
-
383
-
384
-
385
-
386
-
387
-
388
-
389
-
390
-
391
-
392
-
393
-
394
-
395
-
396
 |
 |

337
Overview Operating & Financial Review Governance Financial Statements Shareholder Information
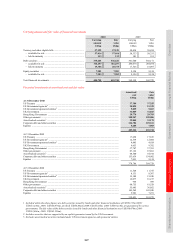
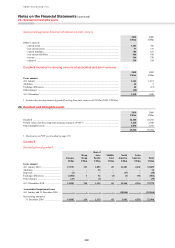
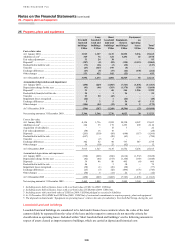
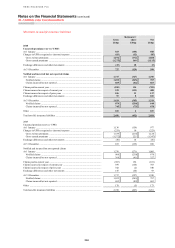
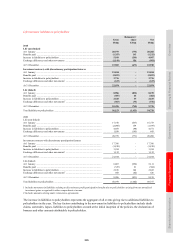
Leasehold land and buildings
2010 2009
Cost
Accumulated
depreciation Cost
Accumulated
depreciation
US$m US$m US$m US$m
At 1 January .................................................................................. 1,824 (831) 1,621 (675)
Additions ...................................................................................... 181 – 175 –
Disposals ....................................................................................... (81) 54 (89) 71
Depreciation charge for the year .................................................. – (133) – (133)
Impairment loss recognised .......................................................... – – – (24)
Exchange differences .................................................................... (16) – 86 (40)
Other changes ............................................................................... 36 (23) 31 (30)
At 31 December ............................................................................ 1,944 (933) 1,824 (831)
Net carrying amount at 31 December ........................................... 1,011 993
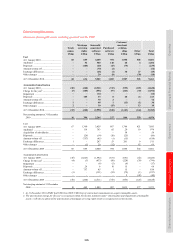
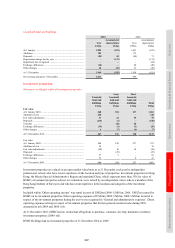
Investment properties
Movement on the fair value of investment properties
Freehold
land and
buildings
Long
leasehold
land and
buildings
Short
leasehold
land and
buildings
Total
US$m US$m US$m US$m
Fair value
At 1 January 2010 ......................................................................... 640 184 237 1,061
Additions at cost ........................................................................... 240 – – 240
Fair value adjustments .................................................................. 31 24 38 93
Disposals ....................................................................................... (216) (2) – (218)
Transfers ....................................................................................... – (42) 42 –
Exchange differences .................................................................... (34) (1) (1) (36)
Other changes ............................................................................... 6 (7) (6) (7)
At 31 December 2010 ................................................................... 667 156 310 1,133
Fair value
At 1 January 2009 ......................................................................... 566 188 217 971
Additions at cost ........................................................................... 36 – – 36
Fair value adjustments .................................................................. (58) 16 18 (24)
Disposals ....................................................................................... – (25) – (25)
Exchange differences .................................................................... 57 5 – 62
Other changes ............................................................................... 39 – 2 41
At 31 December 2009 ................................................................... 640 184 237 1,061
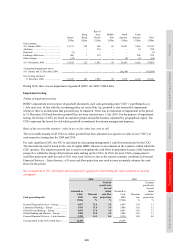
Investment properties are valued on an open market value basis as at 31 December each year by independent
professional valuers who have recent experience in the location and type of properties. Investment properties in Hong
Kong, the Macau Special Administrative Region and mainland China, which represent more than 35% by value of
HSBC’s investment properties subject to revaluation, were valued by an independent valuer who is a member of the
Hong Kong Institute of Surveyors and who has recent experience in the locations and categories of the investment
properties.
Included within ‘Other operating income’ was rental income of US$26m (2009: US$81m; 2008: US$23m) earned by
HSBC on its investment properties. Direct operating expenses of US$3m (2009: US$2m; 2008: US$2m) incurred in
respect of the investment properties during the year were recognised in ‘General and administrative expenses’. Direct
operating expenses arising in respect of investment properties that did not generate rental income during 2010
amounted to nil (2009 and 2008: nil).
At 31 December 2010, HSBC had no contractual obligations to purchase, construct, develop, maintain or enhance
investment properties (2009: nil).
HSBC Holdings had no investment properties at 31 December 2010 or 2009.