HSBC 2010 Annual Report Download - page 334
Download and view the complete annual report
Please find page 334 of the 2010 HSBC annual report below. You can navigate through the pages in the report by either clicking on the pages listed below, or by using the keyword search tool below to find specific information within the annual report.-
 1
1 -
2
-
3
-
4
-
5
-
6
-
7
-
8
-
9
-
10
-
11
-
12
-
13
-
14
-
15
-
16
-
17
-
18
-
19
-
20
-
21
-
22
-
23
-
24
-
25
-
26
-
27
-
28
-
29
-
30
-
31
-
32
-
33
-
34
-
35
-
36
-
37
-
38
-
39
-
40
-
41
-
42
-
43
-
44
-
45
-
46
-
47
-
48
-
49
-
50
-
51
-
52
-
53
-
54
-
55
-
56
-
57
-
58
-
59
-
60
-
61
-
62
-
63
-
64
-
65
-
66
-
67
-
68
-
69
-
70
-
71
-
72
-
73
-
74
-
75
-
76
-
77
-
78
-
79
-
80
-
81
-
82
-
83
-
84
-
85
-
86
-
87
-
88
-
89
-
90
-
91
-
92
-
93
-
94
-
95
-
96
-
97
-
98
-
99
-
100
-
101
-
102
-
103
-
104
-
105
-
106
-
107
-
108
-
109
-
110
-
111
-
112
-
113
-
114
-
115
-
116
-
117
-
118
-
119
-
120
-
121
-
122
-
123
-
124
-
125
-
126
-
127
-
128
-
129
-
130
-
131
-
132
-
133
-
134
-
135
-
136
-
137
-
138
-
139
-
140
-
141
-
142
-
143
-
144
-
145
-
146
-
147
-
148
-
149
-
150
-
151
-
152
-
153
-
154
-
155
-
156
-
157
-
158
-
159
-
160
-
161
-
162
-
163
-
164
-
165
-
166
-
167
-
168
-
169
-
170
-
171
-
172
-
173
-
174
-
175
-
176
-
177
-
178
-
179
-
180
-
181
-
182
-
183
-
184
-
185
-
186
-
187
-
188
-
189
-
190
-
191
-
192
-
193
-
194
-
195
-
196
-
197
-
198
-
199
-
200
-
201
-
202
-
203
-
204
-
205
-
206
-
207
-
208
-
209
-
210
-
211
-
212
-
213
-
214
-
215
-
216
-
217
-
218
-
219
-
220
-
221
-
222
-
223
-
224
-
225
-
226
-
227
-
228
-
229
-
230
-
231
-
232
-
233
-
234
-
235
-
236
-
237
-
238
-
239
-
240
-
241
-
242
-
243
-
244
-
245
-
246
-
247
-
248
-
249
-
250
-
251
-
252
-
253
-
254
-
255
-
256
-
257
-
258
-
259
-
260
-
261
-
262
-
263
-
264
-
265
-
266
-
267
-
268
-
269
-
270
-
271
-
272
-
273
-
274
-
275
-
276
-
277
-
278
-
279
-
280
-
281
-
282
-
283
-
284
-
285
-
286
-
287
-
288
-
289
-
290
-
291
-
292
-
293
-
294
-
295
-
296
-
297
-
298
-
299
-
300
-
301
-
302
-
303
-
304
-
305
-
306
-
307
-
308
-
309
-
310
-
311
-
312
-
313
-
314
-
315
-
316
-
317
-
318
-
319
-
320
-
321
-
322
-
323
-
 324
324 -
 325
325 -
 326
326 -
 327
327 -
 328
328 -
 329
329 -
 330
330 -
 331
331 -
 332
332 -
 333
333 -
 334
334 -
 335
335 -
 336
336 -
 337
337 -
 338
338 -
 339
339 -
 340
340 -
 341
341 -
 342
342 -
 343
343 -
 344
344 -
345
-
346
-
347
-
348
-
349
-
350
-
351
-
352
-
353
-
354
-
355
-
356
-
357
-
358
-
359
-
360
-
361
-
362
-
363
-
364
-
365
-
366
-
367
-
368
-
369
-
370
-
371
-
372
-
373
-
374
-
375
-
376
-
377
-
378
-
379
-
380
-
381
-
382
-
383
-
384
-
385
-
386
-
387
-
388
-
389
-
390
-
391
-
392
-
393
-
394
-
395
-
396
 |
 |

HSBC HOLDINGS PLC
Notes on the Financial Statements (continued)
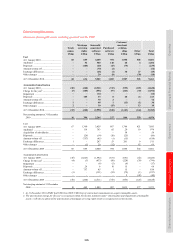
24 – Goodwill and intangible assets
332
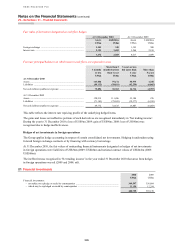
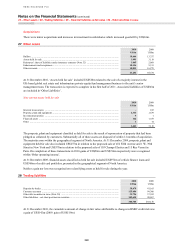
Summarised aggregate financial information on joint ventures
2010 2009
US$m US$m
HSBC’s share of:
– current assets ..................................................................................................................................... 1,481 700
– non-current assets .............................................................................................................................. 97 513
– current liabilities ................................................................................................................................ 706 621
– non-current liabilities ........................................................................................................................ 666 416
– income ............................................................................................................................................... 366 370
– expenses ............................................................................................................................................. 328 324
Goodwill included in carrying amount of associates and joint ventures
2010 2009
US$m US$m
Gross amount
At 1 January .............................................................................................................................................. 1,446 1,453
Additions .................................................................................................................................................. 60 5
Exchange differences ................................................................................................................................ 40 (12)
Other changes ........................................................................................................................................... (28) –
At 31 December1 ....................................................................................................................................... 1,518 1,446
1 Includes the carrying amount of goodwill arising from joint ventures of US$32m (2009: US$32m).
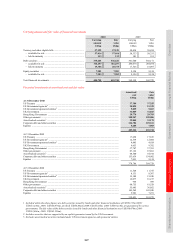
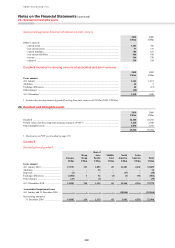
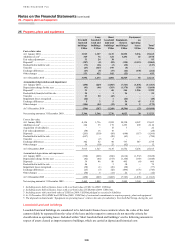
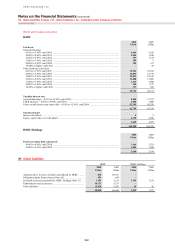
24 Goodwill and intangible assets
2010 2009
US$m US$m
Goodwill ................................................................................................................................................... 22,406 23,241
Present value of in-force long-term insurance business (‘PVIF’)1 .......................................................... 3,440 2,780
Other intangible assets .............................................................................................................................. 4,076 3,973
29,922 29,994
1 Disclosures on PVIF are provided on page 170.
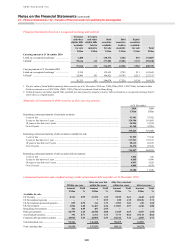
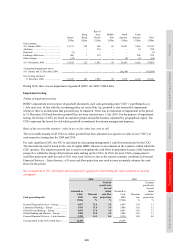
Goodwill
Reconciliation of goodwill
Europe
Hong
Kong
Rest of
Asia-
Pacific
Middle
East
North
America
Latin
America Total
US$m US$m US$m US$m US$m US$m US$m
Gross amount
At 1 January 2010 ................................. 15,915 123 1,053 69 12,483 4,162 33,805
Additions .............................................. – – 16 – – – 16
Disposals ............................................... (3) – – – (17) – (20)
Exchange differences ............................ (1,004) 1 52 (4) (1) 154 (802)
Other changes ....................................... (23) – (6) – – – (29)
At 31 December 2010 ........................... 14,885 124 1,115 65 12,465 4,316 32,970
Accumulated impairment losses
At 1 January and 31 December 2010 ... – – – – (10,564) – (10,564)
Net carrying amount at
31 December 2010 ........................... 14,885 124 1,115 65 1,901 4,316 22,406