HSBC 2010 Annual Report Download - page 15
Download and view the complete annual report
Please find page 15 of the 2010 HSBC annual report below. You can navigate through the pages in the report by either clicking on the pages listed below, or by using the keyword search tool below to find specific information within the annual report.-
 1
1 -
2
-
3
-
4
-
 5
5 -
 6
6 -
 7
7 -
 8
8 -
 9
9 -
 10
10 -
 11
11 -
 12
12 -
 13
13 -
 14
14 -
 15
15 -
 16
16 -
 17
17 -
 18
18 -
 19
19 -
 20
20 -
 21
21 -
 22
22 -
 23
23 -
 24
24 -
 25
25 -
26
-
27
-
28
-
29
-
30
-
31
-
32
-
33
-
34
-
35
-
36
-
37
-
38
-
39
-
40
-
41
-
42
-
43
-
44
-
45
-
46
-
47
-
48
-
49
-
50
-
51
-
52
-
53
-
54
-
55
-
56
-
57
-
58
-
59
-
60
-
61
-
62
-
63
-
64
-
65
-
66
-
67
-
68
-
69
-
70
-
71
-
72
-
73
-
74
-
75
-
76
-
77
-
78
-
79
-
80
-
81
-
82
-
83
-
84
-
85
-
86
-
87
-
88
-
89
-
90
-
91
-
92
-
93
-
94
-
95
-
96
-
97
-
98
-
99
-
100
-
101
-
102
-
103
-
104
-
105
-
106
-
107
-
108
-
109
-
110
-
111
-
112
-
113
-
114
-
115
-
116
-
117
-
118
-
119
-
120
-
121
-
122
-
123
-
124
-
125
-
126
-
127
-
128
-
129
-
130
-
131
-
132
-
133
-
134
-
135
-
136
-
137
-
138
-
139
-
140
-
141
-
142
-
143
-
144
-
145
-
146
-
147
-
148
-
149
-
150
-
151
-
152
-
153
-
154
-
155
-
156
-
157
-
158
-
159
-
160
-
161
-
162
-
163
-
164
-
165
-
166
-
167
-
168
-
169
-
170
-
171
-
172
-
173
-
174
-
175
-
176
-
177
-
178
-
179
-
180
-
181
-
182
-
183
-
184
-
185
-
186
-
187
-
188
-
189
-
190
-
191
-
192
-
193
-
194
-
195
-
196
-
197
-
198
-
199
-
200
-
201
-
202
-
203
-
204
-
205
-
206
-
207
-
208
-
209
-
210
-
211
-
212
-
213
-
214
-
215
-
216
-
217
-
218
-
219
-
220
-
221
-
222
-
223
-
224
-
225
-
226
-
227
-
228
-
229
-
230
-
231
-
232
-
233
-
234
-
235
-
236
-
237
-
238
-
239
-
240
-
241
-
242
-
243
-
244
-
245
-
246
-
247
-
248
-
249
-
250
-
251
-
252
-
253
-
254
-
255
-
256
-
257
-
258
-
259
-
260
-
261
-
262
-
263
-
264
-
265
-
266
-
267
-
268
-
269
-
270
-
271
-
272
-
273
-
274
-
275
-
276
-
277
-
278
-
279
-
280
-
281
-
282
-
283
-
284
-
285
-
286
-
287
-
288
-
289
-
290
-
291
-
292
-
293
-
294
-
295
-
296
-
297
-
298
-
299
-
300
-
301
-
302
-
303
-
304
-
305
-
306
-
307
-
308
-
309
-
310
-
311
-
312
-
313
-
314
-
315
-
316
-
317
-
318
-
319
-
320
-
321
-
322
-
323
-
324
-
325
-
326
-
327
-
328
-
329
-
330
-
331
-
332
-
333
-
334
-
335
-
336
-
337
-
338
-
339
-
340
-
341
-
342
-
343
-
344
-
345
-
346
-
347
-
348
-
349
-
350
-
351
-
352
-
353
-
354
-
355
-
356
-
357
-
358
-
359
-
360
-
361
-
362
-
363
-
364
-
365
-
366
-
367
-
368
-
369
-
370
-
371
-
372
-
373
-
374
-
375
-
376
-
377
-
378
-
379
-
380
-
381
-
382
-
383
-
384
-
385
-
386
-
387
-
388
-
389
-
390
-
391
-
392
-
393
-
394
-
395
-
396
 |
 |

13
Overview Operating & Financial Review Governance Financial Statements Shareholder Information
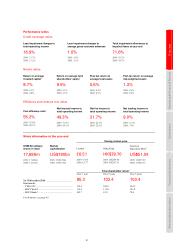
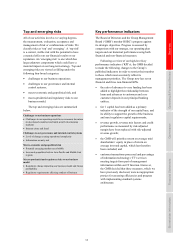
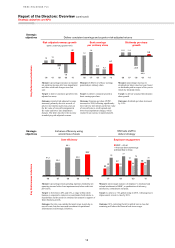
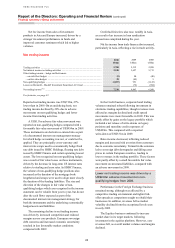
Maintain capital strength and strong liquidity
Strategic
objectives
Return on average
total shareholders’ equity3 Tier 1 capital Advances to core funding ratio
15.7 15.9
4.7 5.1
9.5
'06 '07 '08 '09 '10
9.4 9.3
8.3
10.8
12.1
'06 '07 '08 '09 '10
101.0
70.3
89.1
85.9
55.5
105.0
98.3
103.0
HBEU HBAP HBUS Other
entities
2009 2010
HBEU
8
HBAP
8
HBUS
8
Other
9
entities
Measure: (percentage) profit attributable
to shareholders divided by average total
shareholders’ equity.
Measure: component of regulatory capital
comprising core tier 1 and other tier 1
capital.
Measure: current loans and advances to
customers as a percentage of the total of
core customer deposits and term funding
with a remaining term to maturity in exces
s
of one year.
Target: to maintain a return in the medium
term of between 15% and 19%. In 2011,
we intend to replace the target with one in
the 12% to 15% range over the normal
cycle.
Target: to maintain a strong capital base t
o
support the development of the business
and meet regulatory capital requirements a
t
all times.
Target: to maintain an advances to core
funding ratio below limits set for each
entity.
Outcome: return on equity was below the
target range, but 4.4 percentage points
higher than in 2009.
Outcome: the increase in tier 1 capital to
12.1% reflected the contribution of profit
to capital, the issue of hybrid capital
securities during the year and careful
management of RWAs.
Outcome: ratio within the limits set by the
Risk Management Meeting for each site.
Key Performance Indicators
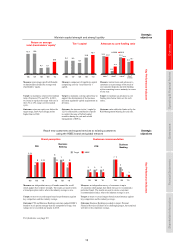
Reach new customers and expand services to existing customers
using the HSBC brand and global network
Strategic
objectives
Brand perception Customer recommendation
9
5
6
8
7
4
9
66 666
'08 '09 '10 '08 '09 '10
333
7
4
0
222
7
2
1
'08 '09 '10 '08 '09 '10
Target HSBC
PFS Business
Banking
PFS
Business
Banking
Measure: an independent survey of brands around the world
which judges their relative strength. The results are used to form
a brand perception index, where the industry average is zero.
Measure: an independent survey of customers in up to
15 countries which judges how likely they are to recommend a
particular brand. The results are used to create a customer
recommendation index, where the industry average is zero.
Target: to meet or exceed targets based on performance against
key competitors and the industry average.
Target: to meet or exceed targets based on performance against
key competitors and the industry average.
Outcome: PFS and Business Banking customers judged HSBC’s
brand to be six points stronger than the competitor average. Our
ratings met or exceeded our targets in 2010.
Outcome: Business Banking exceeded its target. Personal
Financial Services fell short of its challenging target, but remained
well above the competitor average.
Key Performance Indicators
For footnotes, see page 83.