HSBC 2010 Annual Report Download - page 81
Download and view the complete annual report
Please find page 81 of the 2010 HSBC annual report below. You can navigate through the pages in the report by either clicking on the pages listed below, or by using the keyword search tool below to find specific information within the annual report.-
 1
1 -
2
-
3
-
4
-
5
-
6
-
7
-
8
-
9
-
10
-
11
-
12
-
13
-
14
-
15
-
16
-
17
-
18
-
19
-
20
-
21
-
22
-
23
-
24
-
25
-
26
-
27
-
28
-
29
-
30
-
31
-
32
-
33
-
34
-
35
-
36
-
37
-
38
-
39
-
40
-
41
-
42
-
43
-
44
-
45
-
46
-
47
-
48
-
49
-
50
-
51
-
52
-
53
-
54
-
55
-
56
-
57
-
58
-
59
-
60
-
61
-
62
-
63
-
64
-
65
-
66
-
67
-
68
-
69
-
70
-
 71
71 -
 72
72 -
 73
73 -
 74
74 -
 75
75 -
 76
76 -
 77
77 -
 78
78 -
 79
79 -
 80
80 -
 81
81 -
 82
82 -
 83
83 -
 84
84 -
 85
85 -
 86
86 -
 87
87 -
 88
88 -
 89
89 -
 90
90 -
 91
91 -
92
-
93
-
94
-
95
-
96
-
97
-
98
-
99
-
100
-
101
-
102
-
103
-
104
-
105
-
106
-
107
-
108
-
109
-
110
-
111
-
112
-
113
-
114
-
115
-
116
-
117
-
118
-
119
-
120
-
121
-
122
-
123
-
124
-
125
-
126
-
127
-
128
-
129
-
130
-
131
-
132
-
133
-
134
-
135
-
136
-
137
-
138
-
139
-
140
-
141
-
142
-
143
-
144
-
145
-
146
-
147
-
148
-
149
-
150
-
151
-
152
-
153
-
154
-
155
-
156
-
157
-
158
-
159
-
160
-
161
-
162
-
163
-
164
-
165
-
166
-
167
-
168
-
169
-
170
-
171
-
172
-
173
-
174
-
175
-
176
-
177
-
178
-
179
-
180
-
181
-
182
-
183
-
184
-
185
-
186
-
187
-
188
-
189
-
190
-
191
-
192
-
193
-
194
-
195
-
196
-
197
-
198
-
199
-
200
-
201
-
202
-
203
-
204
-
205
-
206
-
207
-
208
-
209
-
210
-
211
-
212
-
213
-
214
-
215
-
216
-
217
-
218
-
219
-
220
-
221
-
222
-
223
-
224
-
225
-
226
-
227
-
228
-
229
-
230
-
231
-
232
-
233
-
234
-
235
-
236
-
237
-
238
-
239
-
240
-
241
-
242
-
243
-
244
-
245
-
246
-
247
-
248
-
249
-
250
-
251
-
252
-
253
-
254
-
255
-
256
-
257
-
258
-
259
-
260
-
261
-
262
-
263
-
264
-
265
-
266
-
267
-
268
-
269
-
270
-
271
-
272
-
273
-
274
-
275
-
276
-
277
-
278
-
279
-
280
-
281
-
282
-
283
-
284
-
285
-
286
-
287
-
288
-
289
-
290
-
291
-
292
-
293
-
294
-
295
-
296
-
297
-
298
-
299
-
300
-
301
-
302
-
303
-
304
-
305
-
306
-
307
-
308
-
309
-
310
-
311
-
312
-
313
-
314
-
315
-
316
-
317
-
318
-
319
-
320
-
321
-
322
-
323
-
324
-
325
-
326
-
327
-
328
-
329
-
330
-
331
-
332
-
333
-
334
-
335
-
336
-
337
-
338
-
339
-
340
-
341
-
342
-
343
-
344
-
345
-
346
-
347
-
348
-
349
-
350
-
351
-
352
-
353
-
354
-
355
-
356
-
357
-
358
-
359
-
360
-
361
-
362
-
363
-
364
-
365
-
366
-
367
-
368
-
369
-
370
-
371
-
372
-
373
-
374
-
375
-
376
-
377
-
378
-
379
-
380
-
381
-
382
-
383
-
384
-
385
-
386
-
387
-
388
-
389
-
390
-
391
-
392
-
393
-
394
-
395
-
396
 |
 |

79
Overview Operating & Financial Review Governance Financial Statements Shareholder Information
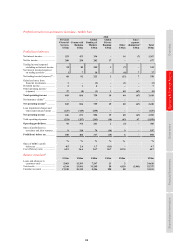
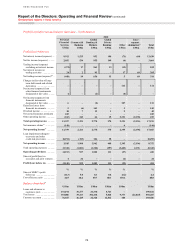
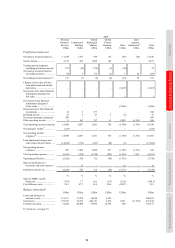
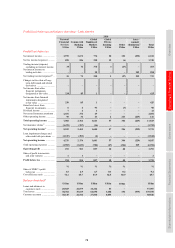
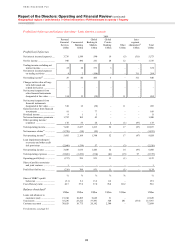
Profit/(loss) before tax and balance sheet data – Latin America
2010
Personal
Financial
Services
US$m
Commercial
Banking
US$m
Global
Banking &
Markets
US$m
Global
Private
Banking
US$m
Other
US$m
Inter-
segment
elimination56
US$m
Total
US$m
Profit/(loss) before tax
Net interest income ..................... 3,975 1,671 776 20 121 (252) 6,311
Net fee income/(expense) ........... 899 526 298 32 (6) – 1,749
Trading income/(expense)
excluding net interest income 35 72 370 3 (27) – 453
Net interest income on
trading activities ..................... – – 28 –– 252 280
Net trading income/(expense)49 .. 35 72 398 3 (27) 252 733
Changes in fair value of long-
term debt issued and related
derivatives .............................. – – – – – – –
Net income from other
financial instruments
designated at fair value ........... 339 85 1 –– – 425
Net income from financial
instruments designated
at fair value ............................. 339 85 1 – – – 425
Gains less losses from
financial investments .............. 6 2 93 – (3) – 98
Dividend income ......................... 7 2 3 – – – 12
Net earned insurance premiums . 1,651 374 29 – – – 2,054
Other operating income .............. 90 34 23 2 221 (229) 141
Total operating income ............ 7,002 2,766 1,621 57 306 (229) 11,523
Net insurance claims57 ................ (1,479) (297) (16) – – – (1,792)
Net operating income46 ............. 5,523 2,469 1,605 57 306 (229) 9,731
Loan impairment charges and
other credit risk provisions ..... (1,247) (293) (4) – – – (1,544)
Net operating income ............... 4,276 2,176 1,601 57 306 (229) 8,187
Total operating expenses ............ (3,983) (1,623) (704) (47) (266) 229 (6,394)
Operating profit ........................ 293 553 897 10 40 – 1,793
Share of profit in associates
and joint ventures ................... 1 1 – – – – 2
Profit before tax ........................ 294 554 897 10 40 – 1,795
% % % %
%
%
Share of HSBC’s profit
before tax ................................ 1.5 2.9 4.7 0.1 0.2 9.4
Cost efficiency ratio ................... 72.1 65.7 43.9 82.5 86.9 65.7
Balance sheet data45
US$m US$m US$m US$m US$m US$m
Loans and advances to
customers (net) ....................... 20,823 24,879 12,242 43 – 57,987
Total assets ................................. 38,764 35,619 64,690 1,608 196 (939) 139,938
Customer accounts ...................... 30,149 24,514 27,810 6,053 – 88,526