HSBC 2010 Annual Report Download - page 319
Download and view the complete annual report
Please find page 319 of the 2010 HSBC annual report below. You can navigate through the pages in the report by either clicking on the pages listed below, or by using the keyword search tool below to find specific information within the annual report.-
 1
1 -
2
-
3
-
4
-
5
-
6
-
7
-
8
-
9
-
10
-
11
-
12
-
13
-
14
-
15
-
16
-
17
-
18
-
19
-
20
-
21
-
22
-
23
-
24
-
25
-
26
-
27
-
28
-
29
-
30
-
31
-
32
-
33
-
34
-
35
-
36
-
37
-
38
-
39
-
40
-
41
-
42
-
43
-
44
-
45
-
46
-
47
-
48
-
49
-
50
-
51
-
52
-
53
-
54
-
55
-
56
-
57
-
58
-
59
-
60
-
61
-
62
-
63
-
64
-
65
-
66
-
67
-
68
-
69
-
70
-
71
-
72
-
73
-
74
-
75
-
76
-
77
-
78
-
79
-
80
-
81
-
82
-
83
-
84
-
85
-
86
-
87
-
88
-
89
-
90
-
91
-
92
-
93
-
94
-
95
-
96
-
97
-
98
-
99
-
100
-
101
-
102
-
103
-
104
-
105
-
106
-
107
-
108
-
109
-
110
-
111
-
112
-
113
-
114
-
115
-
116
-
117
-
118
-
119
-
120
-
121
-
122
-
123
-
124
-
125
-
126
-
127
-
128
-
129
-
130
-
131
-
132
-
133
-
134
-
135
-
136
-
137
-
138
-
139
-
140
-
141
-
142
-
143
-
144
-
145
-
146
-
147
-
148
-
149
-
150
-
151
-
152
-
153
-
154
-
155
-
156
-
157
-
158
-
159
-
160
-
161
-
162
-
163
-
164
-
165
-
166
-
167
-
168
-
169
-
170
-
171
-
172
-
173
-
174
-
175
-
176
-
177
-
178
-
179
-
180
-
181
-
182
-
183
-
184
-
185
-
186
-
187
-
188
-
189
-
190
-
191
-
192
-
193
-
194
-
195
-
196
-
197
-
198
-
199
-
200
-
201
-
202
-
203
-
204
-
205
-
206
-
207
-
208
-
209
-
210
-
211
-
212
-
213
-
214
-
215
-
216
-
217
-
218
-
219
-
220
-
221
-
222
-
223
-
224
-
225
-
226
-
227
-
228
-
229
-
230
-
231
-
232
-
233
-
234
-
235
-
236
-
237
-
238
-
239
-
240
-
241
-
242
-
243
-
244
-
245
-
246
-
247
-
248
-
249
-
250
-
251
-
252
-
253
-
254
-
255
-
256
-
257
-
258
-
259
-
260
-
261
-
262
-
263
-
264
-
265
-
266
-
267
-
268
-
269
-
270
-
271
-
272
-
273
-
274
-
275
-
276
-
277
-
278
-
279
-
280
-
281
-
282
-
283
-
284
-
285
-
286
-
287
-
288
-
289
-
290
-
291
-
292
-
293
-
294
-
295
-
296
-
297
-
298
-
299
-
300
-
301
-
302
-
303
-
304
-
305
-
306
-
307
-
308
-
 309
309 -
 310
310 -
 311
311 -
 312
312 -
 313
313 -
 314
314 -
 315
315 -
 316
316 -
 317
317 -
 318
318 -
 319
319 -
 320
320 -
 321
321 -
 322
322 -
 323
323 -
 324
324 -
 325
325 -
 326
326 -
 327
327 -
 328
328 -
 329
329 -
330
-
331
-
332
-
333
-
334
-
335
-
336
-
337
-
338
-
339
-
340
-
341
-
342
-
343
-
344
-
345
-
346
-
347
-
348
-
349
-
350
-
351
-
352
-
353
-
354
-
355
-
356
-
357
-
358
-
359
-
360
-
361
-
362
-
363
-
364
-
365
-
366
-
367
-
368
-
369
-
370
-
371
-
372
-
373
-
374
-
375
-
376
-
377
-
378
-
379
-
380
-
381
-
382
-
383
-
384
-
385
-
386
-
387
-
388
-
389
-
390
-
391
-
392
-
393
-
394
-
395
-
396
 |
 |

317
Overview Operating & Financial Review Governance Financial Statements Shareholder Information
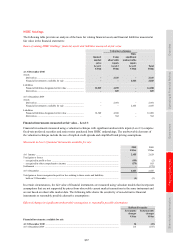
HSBC Holdings
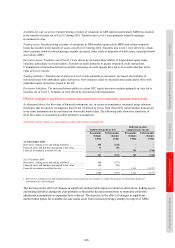
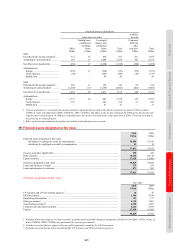
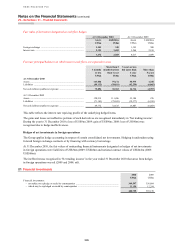
The following table provides an analysis of the basis for valuing financial assets and financial liabilities measured at
fair value in the financial statements:
Bases of valuing HSBC Holdings’ financial assets and liabilities measured at fair value
Valuation techniques
Quoted
market
price
Using
observable
inputs
With
significant
unobservable
inputs
Level 1 Level 2 Level 3 Total
US$m US$m US$m US$m
At 31 December 2010
Assets
Derivatives ................................................................................ – 2,327 – 2,327
Financial investments: available for sale ................................. – – 2,025 2,025
Liabilities
Financial liabilities designated at fair value ............................. 12,029 4,259 – 16,288
Derivatives ................................................................................ – 827 – 827
At 31 December 2009
Assets
Derivatives ................................................................................ – 2,981 – 2,981
Financial investments: available for sale ................................. – – 2,455 2,455
Liabilities
Financial liabilities designated at fair value ............................. 12,549 4,360 – 16,909
Derivatives ................................................................................ – 362 – 362
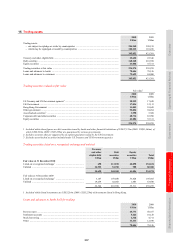
Financial instruments measured at fair value – Level 3
Financial investments measured using a valuation technique with significant unobservable inputs (Level 3) comprise
fixed-rate preferred securities and senior notes purchased from HSBC undertakings. The unobservable elements of
the valuation technique include the use of implied credit spreads and simplified bond pricing assumptions.
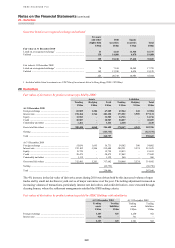
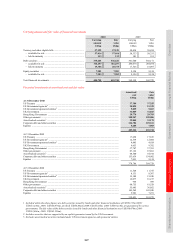
Movement in Level 3 financial instruments available for sale
2010 2009
US$m US$m
At 1 January .............................................................................................................................................. 2,455 2,629
Total gains or losses:
– recognised in profit or loss ................................................................................................................... (155) (2)
– recognised in other comprehensive income ......................................................................................... (275) 103
Settlements ................................................................................................................................................ – (275)
At 31 December ........................................................................................................................................ 2,025 2,455
Total gains or losses recognised in profit or loss relating to those assets and liabilities
held on 31 December ............................................................................................................................ (1) (2)
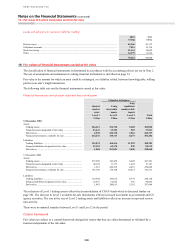
In certain circumstances, the fair value of financial instruments are measured using valuation models that incorporate
assumptions that are not supported by prices from observable current market transactions in the same instrument and
are not based on observable market data. The following table shows the sensitivity of non-derivative financial
instruments to reasonably possible alternative assumptions:
Effect of changes in significant unobservable assumptions to reasonably possible alternatives
Reflected in equity
Favourable
changes
Unfavourable
changes
US$m US$m
Financial investments: available for sale
At 31 December 2010 .............................................................................................................................. 34 (33)
At 31 December 2009 ............................................................................................................................... 115 (107)