HSBC 2010 Annual Report Download - page 226
Download and view the complete annual report
Please find page 226 of the 2010 HSBC annual report below. You can navigate through the pages in the report by either clicking on the pages listed below, or by using the keyword search tool below to find specific information within the annual report.-
 1
1 -
2
-
3
-
4
-
5
-
6
-
7
-
8
-
9
-
10
-
11
-
12
-
13
-
14
-
15
-
16
-
17
-
18
-
19
-
20
-
21
-
22
-
23
-
24
-
25
-
26
-
27
-
28
-
29
-
30
-
31
-
32
-
33
-
34
-
35
-
36
-
37
-
38
-
39
-
40
-
41
-
42
-
43
-
44
-
45
-
46
-
47
-
48
-
49
-
50
-
51
-
52
-
53
-
54
-
55
-
56
-
57
-
58
-
59
-
60
-
61
-
62
-
63
-
64
-
65
-
66
-
67
-
68
-
69
-
70
-
71
-
72
-
73
-
74
-
75
-
76
-
77
-
78
-
79
-
80
-
81
-
82
-
83
-
84
-
85
-
86
-
87
-
88
-
89
-
90
-
91
-
92
-
93
-
94
-
95
-
96
-
97
-
98
-
99
-
100
-
101
-
102
-
103
-
104
-
105
-
106
-
107
-
108
-
109
-
110
-
111
-
112
-
113
-
114
-
115
-
116
-
117
-
118
-
119
-
120
-
121
-
122
-
123
-
124
-
125
-
126
-
127
-
128
-
129
-
130
-
131
-
132
-
133
-
134
-
135
-
136
-
137
-
138
-
139
-
140
-
141
-
142
-
143
-
144
-
145
-
146
-
147
-
148
-
149
-
150
-
151
-
152
-
153
-
154
-
155
-
156
-
157
-
158
-
159
-
160
-
161
-
162
-
163
-
164
-
165
-
166
-
167
-
168
-
169
-
170
-
171
-
172
-
173
-
174
-
175
-
176
-
177
-
178
-
179
-
180
-
181
-
182
-
183
-
184
-
185
-
186
-
187
-
188
-
189
-
190
-
191
-
192
-
193
-
194
-
195
-
196
-
197
-
198
-
199
-
200
-
201
-
202
-
203
-
204
-
205
-
206
-
207
-
208
-
209
-
210
-
211
-
212
-
213
-
214
-
215
-
 216
216 -
 217
217 -
 218
218 -
 219
219 -
 220
220 -
 221
221 -
 222
222 -
 223
223 -
 224
224 -
 225
225 -
 226
226 -
 227
227 -
 228
228 -
 229
229 -
 230
230 -
 231
231 -
 232
232 -
 233
233 -
 234
234 -
 235
235 -
 236
236 -
237
-
238
-
239
-
240
-
241
-
242
-
243
-
244
-
245
-
246
-
247
-
248
-
249
-
250
-
251
-
252
-
253
-
254
-
255
-
256
-
257
-
258
-
259
-
260
-
261
-
262
-
263
-
264
-
265
-
266
-
267
-
268
-
269
-
270
-
271
-
272
-
273
-
274
-
275
-
276
-
277
-
278
-
279
-
280
-
281
-
282
-
283
-
284
-
285
-
286
-
287
-
288
-
289
-
290
-
291
-
292
-
293
-
294
-
295
-
296
-
297
-
298
-
299
-
300
-
301
-
302
-
303
-
304
-
305
-
306
-
307
-
308
-
309
-
310
-
311
-
312
-
313
-
314
-
315
-
316
-
317
-
318
-
319
-
320
-
321
-
322
-
323
-
324
-
325
-
326
-
327
-
328
-
329
-
330
-
331
-
332
-
333
-
334
-
335
-
336
-
337
-
338
-
339
-
340
-
341
-
342
-
343
-
344
-
345
-
346
-
347
-
348
-
349
-
350
-
351
-
352
-
353
-
354
-
355
-
356
-
357
-
358
-
359
-
360
-
361
-
362
-
363
-
364
-
365
-
366
-
367
-
368
-
369
-
370
-
371
-
372
-
373
-
374
-
375
-
376
-
377
-
378
-
379
-
380
-
381
-
382
-
383
-
384
-
385
-
386
-
387
-
388
-
389
-
390
-
391
-
392
-
393
-
394
-
395
-
396
 |
 |

HSBC HOLDINGS PLC
Directors’ Remuneration Report (continued)
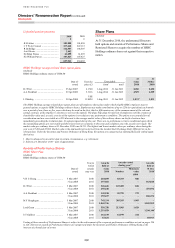
Executive Directors’ remuneration > 2010 emoluments / Salary / Annual bonus
224
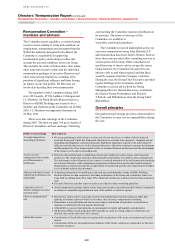
In order to ensure that executive Directors’
remuneration packages are competitive, having
regard to the market in which we compete for
executive talent, the Committee considers market
data from a defined remuneration comparator group.
This group comprises of nine global financial
services companies, namely Banco Santander, Bank
of America, Barclays, BNP Paribas, Citigroup,
Deutsche Bank, JPMorgan Chase & Co, Standard
Chartered and UBS. These companies were selected
on the basis of their broadly similar business
coverage, size and international scope, and are
subject to annual review for continuing relevance.
The positioning of total remuneration (salary,
bonus and the expected value of long-term
incentives) for the executive Directors depends on
the performance of the Group and individual
performance assessed against a combination of
financial and non-financial objectives within an
annual balanced scorecard. The annual objectives in
themselves are derived from medium term strategic
plans.
The above approach applies to all executive
Directors with the exception of the Group Chairman,
D J Flint who from 2011 will no longer receive
annual bonus payments and is not expected to be
granted awards of Performance Shares, and
S T Gulliver, whose variable compensation
arrangements for 2010 take into account wholesale
banking market practice. With effect from 2011,
S T Gulliver will be subject to the same
arrangements as other executive Directors.
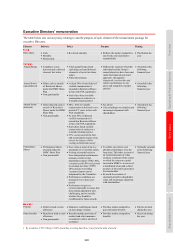
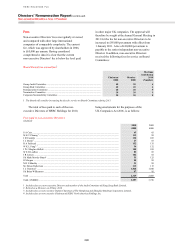
Executive Directors’ 2010 emoluments and
remuneration
The emoluments of the Group Chairman and
executive Directors of HSBC Holdings for 2010,
disclosed pursuant to section 421 of the UK
Companies Act 2006 and the Large and Medium-
sized Companies and Groups (Accounts and
Reports) Regulations 2008, were as follows:
V H C Cheng D J Flint A A Flockhart M F Geoghegan1Lord Green2 S T Gulliver I J Mackay3
(Audited) 2010 2009 2010 2009 2010 2009 2010 2009 2010 2009 2010 2009 2010 2009
£000
Salary ............ 775 769 845 700 820 662 1,164 1,070 1,160 1,250 800 800 57 –
Allowances4 .. 193 191 434 394 – – 421 548 31 8 154 8 36 –
Benefits in
kind5 ............. 311 663 8 8 629 437 430 57 3 4 17 18 27 –
Bonus6 ........... 284 – 1,805 – 1,385 – 2,824 – – – 2,934 – 24 –
Total
emoluments .. 1,563 1,623 3,092 1,102 2,834 1,099 4,839 1,675 1,194 1,262 3,905 826 144 –
US$000
Total
emoluments ..
2,414 2,532 4,775 1,719 4,377 1,714 7,473 2,613 1,844 1,969 6,031 1,288 222 –
The total remuneration of the Group Chairman and executive Directors of HSBC Holdings for 2010, disclosed
pursuant to the UK Listing Rules, was as follows:
V H C Cheng D J Flint A A Flockhart M F Geoghegan1Lord Green2 S T Gulliver I J Mackay3
(Unaudited) 2010 2009 2010 2009 2010 2009 2010 2009 2010 2009 2010 2009 2010 2009
£000
Salary,
allowances
and benefits
in kind ........ 1,279 1,623 1,287 1,102 1,449 1,099 2,015 1,675 1,194 1,262 971 826 120 –
Bonus7 ........... 711 1,240 2,800 2,100 1,808 1,908 3,800 4,000 – – 5,200 9,000 61 –
Total
remuneration 1,990 2,863 4,087 3,202 3,257 3,007 5,815 5,675 1,194 1,262 6,171 9,826 181 –
US$000
Total
remuneration 3,073 4,466 6,312 4,995 5,030 4,691 8,980 8,852 1,844 1,969 9,530 15,327 280 –
The variance in the above tables is caused by the different definitions of bonus under the UK Companies Act
2006 and the UK Listing Rules. Explanations of the constituent parts of the bonus calculated pursuant to the UK
Companies Act 2006 and the UK Listing Rules are given in footnotes 6 and 7 respectively.
1 Stepped down as Group Chief Executive and a Director of HSBC Holdings on 31 December 2010. Retires from the Group on
31 March 2011.
2 Retired as Group Chairman and a Director of HSBC Holdings on 3 December 2010.
3 Appointed a Director of HSBC Holdings on 3 December 2010.