HSBC 2010 Annual Report Download - page 246
Download and view the complete annual report
Please find page 246 of the 2010 HSBC annual report below. You can navigate through the pages in the report by either clicking on the pages listed below, or by using the keyword search tool below to find specific information within the annual report.-
 1
1 -
2
-
3
-
4
-
5
-
6
-
7
-
8
-
9
-
10
-
11
-
12
-
13
-
14
-
15
-
16
-
17
-
18
-
19
-
20
-
21
-
22
-
23
-
24
-
25
-
26
-
27
-
28
-
29
-
30
-
31
-
32
-
33
-
34
-
35
-
36
-
37
-
38
-
39
-
40
-
41
-
42
-
43
-
44
-
45
-
46
-
47
-
48
-
49
-
50
-
51
-
52
-
53
-
54
-
55
-
56
-
57
-
58
-
59
-
60
-
61
-
62
-
63
-
64
-
65
-
66
-
67
-
68
-
69
-
70
-
71
-
72
-
73
-
74
-
75
-
76
-
77
-
78
-
79
-
80
-
81
-
82
-
83
-
84
-
85
-
86
-
87
-
88
-
89
-
90
-
91
-
92
-
93
-
94
-
95
-
96
-
97
-
98
-
99
-
100
-
101
-
102
-
103
-
104
-
105
-
106
-
107
-
108
-
109
-
110
-
111
-
112
-
113
-
114
-
115
-
116
-
117
-
118
-
119
-
120
-
121
-
122
-
123
-
124
-
125
-
126
-
127
-
128
-
129
-
130
-
131
-
132
-
133
-
134
-
135
-
136
-
137
-
138
-
139
-
140
-
141
-
142
-
143
-
144
-
145
-
146
-
147
-
148
-
149
-
150
-
151
-
152
-
153
-
154
-
155
-
156
-
157
-
158
-
159
-
160
-
161
-
162
-
163
-
164
-
165
-
166
-
167
-
168
-
169
-
170
-
171
-
172
-
173
-
174
-
175
-
176
-
177
-
178
-
179
-
180
-
181
-
182
-
183
-
184
-
185
-
186
-
187
-
188
-
189
-
190
-
191
-
192
-
193
-
194
-
195
-
196
-
197
-
198
-
199
-
200
-
201
-
202
-
203
-
204
-
205
-
206
-
207
-
208
-
209
-
210
-
211
-
212
-
213
-
214
-
215
-
216
-
217
-
218
-
219
-
220
-
221
-
222
-
223
-
224
-
225
-
226
-
227
-
228
-
229
-
230
-
231
-
232
-
233
-
234
-
235
-
 236
236 -
 237
237 -
 238
238 -
 239
239 -
 240
240 -
 241
241 -
 242
242 -
 243
243 -
 244
244 -
 245
245 -
 246
246 -
 247
247 -
 248
248 -
 249
249 -
 250
250 -
 251
251 -
 252
252 -
 253
253 -
 254
254 -
 255
255 -
 256
256 -
257
-
258
-
259
-
260
-
261
-
262
-
263
-
264
-
265
-
266
-
267
-
268
-
269
-
270
-
271
-
272
-
273
-
274
-
275
-
276
-
277
-
278
-
279
-
280
-
281
-
282
-
283
-
284
-
285
-
286
-
287
-
288
-
289
-
290
-
291
-
292
-
293
-
294
-
295
-
296
-
297
-
298
-
299
-
300
-
301
-
302
-
303
-
304
-
305
-
306
-
307
-
308
-
309
-
310
-
311
-
312
-
313
-
314
-
315
-
316
-
317
-
318
-
319
-
320
-
321
-
322
-
323
-
324
-
325
-
326
-
327
-
328
-
329
-
330
-
331
-
332
-
333
-
334
-
335
-
336
-
337
-
338
-
339
-
340
-
341
-
342
-
343
-
344
-
345
-
346
-
347
-
348
-
349
-
350
-
351
-
352
-
353
-
354
-
355
-
356
-
357
-
358
-
359
-
360
-
361
-
362
-
363
-
364
-
365
-
366
-
367
-
368
-
369
-
370
-
371
-
372
-
373
-
374
-
375
-
376
-
377
-
378
-
379
-
380
-
381
-
382
-
383
-
384
-
385
-
386
-
387
-
388
-
389
-
390
-
391
-
392
-
393
-
394
-
395
-
396
 |
 |

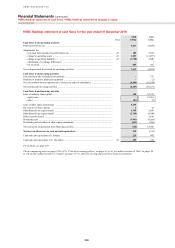
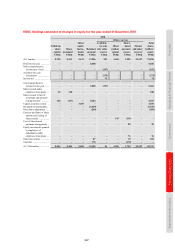
HSBC HOLDINGS PLC
Financial Statements (continued)
Consolidated statement of changes in equity / HSBC Holdings balance sheet
244
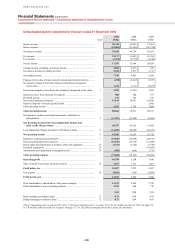
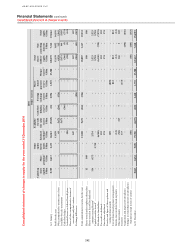
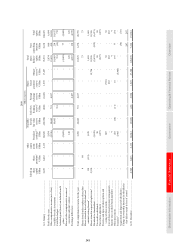
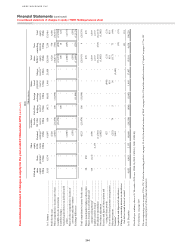
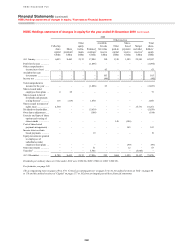
Consolidated statement of changes in equity for the year ended 31 December 2010 (continued)
2008
Other reserves
Called up
share
capital
Share
premium2
Other
equity
instru-
ments
Retained
earnings3,4
Available-
for-sale
fair value
reserve
Cash flow
hedging
reserve5
Foreign
exchange
reserve
Share-
based
payment
reserve
Merger
reserve3,6
Total
share-
holders’
equity
Non-
controlling
interests
Total
equity
US$m US$m US$m US$m US$m US$m US$m US$m US$m US$m US$m US$m
At 1 January ........................................................ 5,915 8,134 – 81,097 850 (917) 10,055 1,968 21,058 128,160 7,256 135,416
Profit for the year ................................................ – – – 5,728 – – – – – 5,728 770 6,498
Other comprehensive income (net of tax) .......... – – – (1,605) (21,474) 106 (11,898) – – (34,871) (766) (35,637)
Available-for-sale investments ........................... – – – – (21,474) – – – – (21,474) (430) (21,904)
Cash flow hedges ................................................ – – – – – 106 – – – 106 18 124
Actuarial gains/(losses) on defined benefit
plans ................................................................ – – – (1,046) – – – – – (1,046) (129) (1,175)
Share of other comprehensive income of
associates and joint ventures .......................... – – – (559) – – – – – (559) – (559)
Exchange differences ......................................... – – – – – – (11,898) – – (11,898) (225) (12,123)
Total comprehensive income for the year .......... – – – 4,123 (21,474) 106 (11,898) – – (29,143) 4 (29,139)
Shares issued under employee share plans ........ 20 450 – – – – – – – 470 – 470
Shares issued in lieu of dividends and
amounts arising thereon2 ................................ 118
(121) – 3,596 – – – – – 3,593 – 3,593
Capital securities issued7 .................................... – – 2,133 – – – – – – 2,133 – 2,133
Dividends to shareholders .................................. – – – (11,301) – – – – – (11,301) (813) (12,114)
Own shares adjustment ....................................... – – – (1,002) – – – – – (1,002) – (1,002)
Exercise and lapse of share options and
vesting of share awards .................................. – – –
827 – – – (848) – (21) – (21)
Cost of share-based payment arrangements ....... – – – – – – – 819 – 819 – 819
Other movements ................................................ – – – (252) 74 5 – 56 – (117) 73 (44)
Transfers6 ............................................................ – – – 3,601 – – – – (3,601) – – –
Acquisition and disposal of subsidiaries ............. – – – – – – – – – – (33) (33)
Change in ownership interests in subsidiaries
that did not result in loss of control ............... – – – – – – – – – – 151 151
At 31 December .................................................. 6,053 8,463 2,133 80,689 (20,550) (806) (1,843) 1,995 17,457 93,591 6,638 100,229
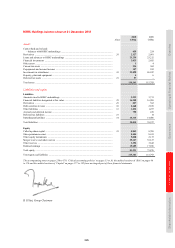
Dividends per ordinary share at 31 December 2010 were US$0.34 (2009: US$0.34; 2008: US$0.93).
For footnotes, see page 249.
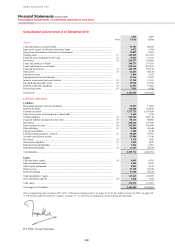
The accompanying notes on pages 250 to 370, ‘Critical accounting policies’ on pages 33 to 36, the audited sections of ‘Risk’ on pages 86 to 176 and the audited sections of ‘Capital’ on pages 177 to 182
form an integral part of these financial statements.