HSBC 2010 Annual Report Download - page 286
Download and view the complete annual report
Please find page 286 of the 2010 HSBC annual report below. You can navigate through the pages in the report by either clicking on the pages listed below, or by using the keyword search tool below to find specific information within the annual report.-
 1
1 -
2
-
3
-
4
-
5
-
6
-
7
-
8
-
9
-
10
-
11
-
12
-
13
-
14
-
15
-
16
-
17
-
18
-
19
-
20
-
21
-
22
-
23
-
24
-
25
-
26
-
27
-
28
-
29
-
30
-
31
-
32
-
33
-
34
-
35
-
36
-
37
-
38
-
39
-
40
-
41
-
42
-
43
-
44
-
45
-
46
-
47
-
48
-
49
-
50
-
51
-
52
-
53
-
54
-
55
-
56
-
57
-
58
-
59
-
60
-
61
-
62
-
63
-
64
-
65
-
66
-
67
-
68
-
69
-
70
-
71
-
72
-
73
-
74
-
75
-
76
-
77
-
78
-
79
-
80
-
81
-
82
-
83
-
84
-
85
-
86
-
87
-
88
-
89
-
90
-
91
-
92
-
93
-
94
-
95
-
96
-
97
-
98
-
99
-
100
-
101
-
102
-
103
-
104
-
105
-
106
-
107
-
108
-
109
-
110
-
111
-
112
-
113
-
114
-
115
-
116
-
117
-
118
-
119
-
120
-
121
-
122
-
123
-
124
-
125
-
126
-
127
-
128
-
129
-
130
-
131
-
132
-
133
-
134
-
135
-
136
-
137
-
138
-
139
-
140
-
141
-
142
-
143
-
144
-
145
-
146
-
147
-
148
-
149
-
150
-
151
-
152
-
153
-
154
-
155
-
156
-
157
-
158
-
159
-
160
-
161
-
162
-
163
-
164
-
165
-
166
-
167
-
168
-
169
-
170
-
171
-
172
-
173
-
174
-
175
-
176
-
177
-
178
-
179
-
180
-
181
-
182
-
183
-
184
-
185
-
186
-
187
-
188
-
189
-
190
-
191
-
192
-
193
-
194
-
195
-
196
-
197
-
198
-
199
-
200
-
201
-
202
-
203
-
204
-
205
-
206
-
207
-
208
-
209
-
210
-
211
-
212
-
213
-
214
-
215
-
216
-
217
-
218
-
219
-
220
-
221
-
222
-
223
-
224
-
225
-
226
-
227
-
228
-
229
-
230
-
231
-
232
-
233
-
234
-
235
-
236
-
237
-
238
-
239
-
240
-
241
-
242
-
243
-
244
-
245
-
246
-
247
-
248
-
249
-
250
-
251
-
252
-
253
-
254
-
255
-
256
-
257
-
258
-
259
-
260
-
261
-
262
-
263
-
264
-
265
-
266
-
267
-
268
-
269
-
270
-
271
-
272
-
273
-
274
-
275
-
 276
276 -
 277
277 -
 278
278 -
 279
279 -
 280
280 -
 281
281 -
 282
282 -
 283
283 -
 284
284 -
 285
285 -
 286
286 -
 287
287 -
 288
288 -
 289
289 -
 290
290 -
 291
291 -
 292
292 -
 293
293 -
 294
294 -
 295
295 -
 296
296 -
297
-
298
-
299
-
300
-
301
-
302
-
303
-
304
-
305
-
306
-
307
-
308
-
309
-
310
-
311
-
312
-
313
-
314
-
315
-
316
-
317
-
318
-
319
-
320
-
321
-
322
-
323
-
324
-
325
-
326
-
327
-
328
-
329
-
330
-
331
-
332
-
333
-
334
-
335
-
336
-
337
-
338
-
339
-
340
-
341
-
342
-
343
-
344
-
345
-
346
-
347
-
348
-
349
-
350
-
351
-
352
-
353
-
354
-
355
-
356
-
357
-
358
-
359
-
360
-
361
-
362
-
363
-
364
-
365
-
366
-
367
-
368
-
369
-
370
-
371
-
372
-
373
-
374
-
375
-
376
-
377
-
378
-
379
-
380
-
381
-
382
-
383
-
384
-
385
-
386
-
387
-
388
-
389
-
390
-
391
-
392
-
393
-
394
-
395
-
396
 |
 |

HSBC HOLDINGS PLC
Notes on the Financial Statements (continued)
7 – Employee compensation and benefits / 8 – Auditors’ remuneration
284
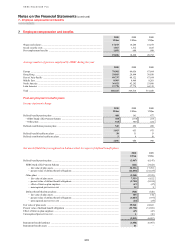
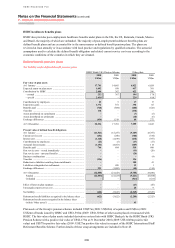
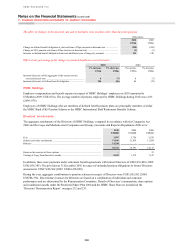
The effect of changes in the discount rate and in mortality rates on plans other than the principal plan
Other plans
2010 2009
US$m US$m
Change in defined benefit obligation at year end from a 25bps increase in discount rate ..................... (290) (269)
Change in 2011 pension cost from a 25bps increase in discount rate .................................................... (1) (3)
Increase in defined benefit obligation from each additional year of longevity assumed ....................... 131 120
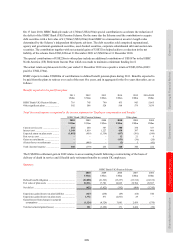
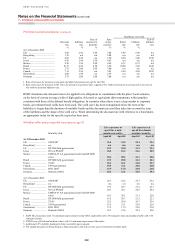
Effect of one percentage point change in assumed healthcare cost trend rates
2010 2009
1% increase 1% decrease 1% increase 1% decrease
US$m US$m US$m US$m
Increase/(decrease) of the aggregate of the current service
cost and interest cost ................................................................ 8 (7) 8 (7)
Increase/(decrease) of defined benefit obligation ........................ 106 (86) 86 (75)
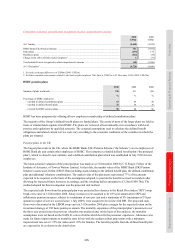
HSBC Holdings
Employee compensation and benefit expense in respect of HSBC Holdings’ employees in 2010 amounted to
US$244m (2009: US$217m). The average number of persons employed by HSBC Holdings during 2010 was 1,015
(2009: 876).
Employees of HSBC Holdings who are members of defined benefit pension plans are principally members of either
the HSBC Bank (UK) Pension Scheme or the HSBC International Staff Retirement Benefits Scheme.
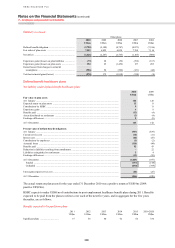
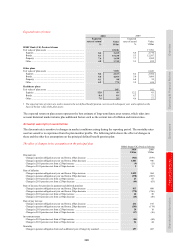
Directors’ emoluments
The aggregate emoluments of the Directors of HSBC Holdings, computed in accordance with the Companies Act
2006 and the Large and Medium-sized Companies and Groups (Accounts and Reports) Regulations 2008 were:
2010 2009 2008
US$000 US$000 US$000
Fees ............................................................................................................................. 3,597 3,756 2,529
Salaries and other emoluments ................................................................................... 12,841 11,835 11,584
Bonuses ....................................................................................................................... 14,294 – –
30,732 15,591 14,113
Gains on the exercise of share options ....................................................................... – – 23
Vesting of Long-Term Incentive awards .................................................................... 8,523 1,579 7,147
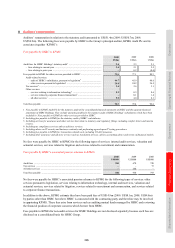
In addition, there were payments under retirement benefit agreements with former Directors of US$1,016,089 (2009:
US$1,036,385). The provision at 31 December 2010 in respect of unfunded pension obligations to former Directors
amounted to US$17,628,508 (2009: US$16,296,028).
During the year, aggregate contributions to pension schemes in respect of Directors were US$1,055,582 (2009:
US$788,734). Discretionary bonuses for Directors are based on a combination of individual and corporate
performance and are determined by the Remuneration Committee. Details of Directors’ remuneration, share options
and conditional awards under the Restricted Share Plan 2000 and the HSBC Share Plan are included in the
‘Directors’ Remuneration Report’ on pages 232 and 233.