HSBC 2010 Annual Report Download - page 312
Download and view the complete annual report
Please find page 312 of the 2010 HSBC annual report below. You can navigate through the pages in the report by either clicking on the pages listed below, or by using the keyword search tool below to find specific information within the annual report.-
 1
1 -
2
-
3
-
4
-
5
-
6
-
7
-
8
-
9
-
10
-
11
-
12
-
13
-
14
-
15
-
16
-
17
-
18
-
19
-
20
-
21
-
22
-
23
-
24
-
25
-
26
-
27
-
28
-
29
-
30
-
31
-
32
-
33
-
34
-
35
-
36
-
37
-
38
-
39
-
40
-
41
-
42
-
43
-
44
-
45
-
46
-
47
-
48
-
49
-
50
-
51
-
52
-
53
-
54
-
55
-
56
-
57
-
58
-
59
-
60
-
61
-
62
-
63
-
64
-
65
-
66
-
67
-
68
-
69
-
70
-
71
-
72
-
73
-
74
-
75
-
76
-
77
-
78
-
79
-
80
-
81
-
82
-
83
-
84
-
85
-
86
-
87
-
88
-
89
-
90
-
91
-
92
-
93
-
94
-
95
-
96
-
97
-
98
-
99
-
100
-
101
-
102
-
103
-
104
-
105
-
106
-
107
-
108
-
109
-
110
-
111
-
112
-
113
-
114
-
115
-
116
-
117
-
118
-
119
-
120
-
121
-
122
-
123
-
124
-
125
-
126
-
127
-
128
-
129
-
130
-
131
-
132
-
133
-
134
-
135
-
136
-
137
-
138
-
139
-
140
-
141
-
142
-
143
-
144
-
145
-
146
-
147
-
148
-
149
-
150
-
151
-
152
-
153
-
154
-
155
-
156
-
157
-
158
-
159
-
160
-
161
-
162
-
163
-
164
-
165
-
166
-
167
-
168
-
169
-
170
-
171
-
172
-
173
-
174
-
175
-
176
-
177
-
178
-
179
-
180
-
181
-
182
-
183
-
184
-
185
-
186
-
187
-
188
-
189
-
190
-
191
-
192
-
193
-
194
-
195
-
196
-
197
-
198
-
199
-
200
-
201
-
202
-
203
-
204
-
205
-
206
-
207
-
208
-
209
-
210
-
211
-
212
-
213
-
214
-
215
-
216
-
217
-
218
-
219
-
220
-
221
-
222
-
223
-
224
-
225
-
226
-
227
-
228
-
229
-
230
-
231
-
232
-
233
-
234
-
235
-
236
-
237
-
238
-
239
-
240
-
241
-
242
-
243
-
244
-
245
-
246
-
247
-
248
-
249
-
250
-
251
-
252
-
253
-
254
-
255
-
256
-
257
-
258
-
259
-
260
-
261
-
262
-
263
-
264
-
265
-
266
-
267
-
268
-
269
-
270
-
271
-
272
-
273
-
274
-
275
-
276
-
277
-
278
-
279
-
280
-
281
-
282
-
283
-
284
-
285
-
286
-
287
-
288
-
289
-
290
-
291
-
292
-
293
-
294
-
295
-
296
-
297
-
298
-
299
-
300
-
301
-
 302
302 -
 303
303 -
 304
304 -
 305
305 -
 306
306 -
 307
307 -
 308
308 -
 309
309 -
 310
310 -
 311
311 -
 312
312 -
 313
313 -
 314
314 -
 315
315 -
 316
316 -
 317
317 -
 318
318 -
 319
319 -
 320
320 -
 321
321 -
 322
322 -
323
-
324
-
325
-
326
-
327
-
328
-
329
-
330
-
331
-
332
-
333
-
334
-
335
-
336
-
337
-
338
-
339
-
340
-
341
-
342
-
343
-
344
-
345
-
346
-
347
-
348
-
349
-
350
-
351
-
352
-
353
-
354
-
355
-
356
-
357
-
358
-
359
-
360
-
361
-
362
-
363
-
364
-
365
-
366
-
367
-
368
-
369
-
370
-
371
-
372
-
373
-
374
-
375
-
376
-
377
-
378
-
379
-
380
-
381
-
382
-
383
-
384
-
385
-
386
-
387
-
388
-
389
-
390
-
391
-
392
-
393
-
394
-
395
-
396
 |
 |

HSBC HOLDINGS PLC
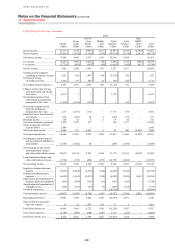
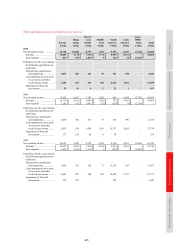
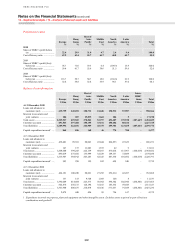
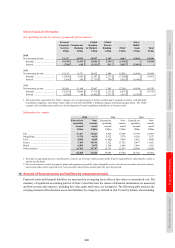
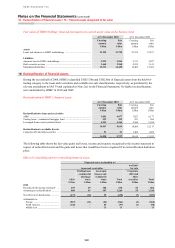
Notes on the Financial Statements (continued)
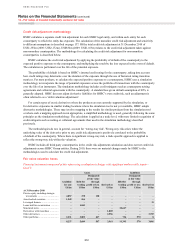
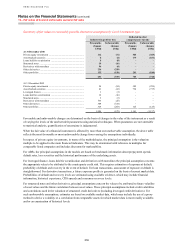
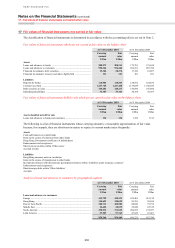
16 – Fair values of financial instruments carried at fair value
310
Valuation techniques incorporate assumptions about factors that other market participants would use in their
valuations, including interest rate yield curves, exchange rates, volatilities, and prepayment and default rates. During
the year, as a result of evolving market practice in the pricing of certain interest rate derivatives, HSBC has, for single
currency swaps with collateralised counterparties and in significant major currencies, adopted a discounting curve
that reflects the overnight interest rate (‘OIS discounting’). Previously, in line with market practice, discount curves
did not reflect this overnight interest rate component but were based on a term LIBOR rate. The financial effect of
this change was not significant.
The majority of valuation techniques employ only observable market data. However, certain financial instruments are
valued on the basis of valuation techniques that feature one or more significant market inputs that are unobservable,
and for them, the derivation of fair value is more judgemental. An instrument in its entirety is classified as valued
using significant unobservable inputs if, in the opinion of management, a significant proportion of the instrument’s
carrying amount and/or inception profit (‘day 1 gain or loss’) is driven by unobservable inputs. ‘Unobservable’ in this
context means that there is little or no current market data available from which to determine the price at which an
arm’s length transaction would be likely to occur. It generally does not mean that there is no data available at all upon
which to base a determination of fair value (consensus pricing data may, for example, be used).
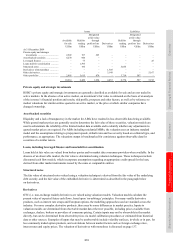
In certain circumstances, primarily where debt is hedged with interest rate derivatives, HSBC records its own debt in
issue at fair value, based on quoted prices in an active market for the specific instrument concerned, if available.
When quoted market prices are unavailable, the own debt in issue is valued using valuation techniques, the inputs for
which are either based upon quoted prices in an inactive market for the instrument, or are estimated by comparison
with quoted prices in an active market for similar instruments. In both cases, the fair value includes the effect of
applying the credit spread which is appropriate to HSBC’s liabilities. The change in fair value of issued debt
securities attributable to the Group’s own credit spread is computed as follows: for each security at each reporting
date, an externally verifiable price is obtained or a price is derived using credit spreads for similar securities for the
same issuer. Then, using discounted cash flow, each security is valued using a LIBOR-based discount curve. The
difference in the valuations is attributable to the Group’s own credit spread. This methodology is applied consistently
across all securities.
Structured notes issued and certain other hybrid instrument liabilities are included within trading liabilities and are
measured at fair value. The credit spread applied to these instruments is derived from the spreads at which HSBC
issues structured notes. These market spreads are smaller than credit spreads observed for plain vanilla debt or in the
credit default swap markets.
Gains and losses arising from changes in the credit spread of liabilities issued by HSBC reverse over the contractual
life of the debt, provided that the debt is not repaid at a premium or a discount.
Fair value adjustments
Fair value adjustments are adopted when HSBC considers that there are additional factors that would be considered
by a market participant that are not incorporated within the valuation model. The magnitude of fair value adjustments
depends upon many entity-specific factors, and therefore fair value adjustments may not be comparable across the
banking industry.
HSBC classifies fair value adjustments as either ‘risk-related’ or ‘model-related’. The majority of these adjustments
relate to Global Banking and Markets.
Movements in the level of fair value adjustments do not necessarily result in the recognition of profits or losses
within the income statement. For example, as models are enhanced, fair value adjustments may no longer be required.
Similarly, fair value adjustments will decrease when the related positions are unwound, but this may not result in
profit or loss.