HSBC 2010 Annual Report Download - page 363
Download and view the complete annual report
Please find page 363 of the 2010 HSBC annual report below. You can navigate through the pages in the report by either clicking on the pages listed below, or by using the keyword search tool below to find specific information within the annual report.-
 1
1 -
2
-
3
-
4
-
5
-
6
-
7
-
8
-
9
-
10
-
11
-
12
-
13
-
14
-
15
-
16
-
17
-
18
-
19
-
20
-
21
-
22
-
23
-
24
-
25
-
26
-
27
-
28
-
29
-
30
-
31
-
32
-
33
-
34
-
35
-
36
-
37
-
38
-
39
-
40
-
41
-
42
-
43
-
44
-
45
-
46
-
47
-
48
-
49
-
50
-
51
-
52
-
53
-
54
-
55
-
56
-
57
-
58
-
59
-
60
-
61
-
62
-
63
-
64
-
65
-
66
-
67
-
68
-
69
-
70
-
71
-
72
-
73
-
74
-
75
-
76
-
77
-
78
-
79
-
80
-
81
-
82
-
83
-
84
-
85
-
86
-
87
-
88
-
89
-
90
-
91
-
92
-
93
-
94
-
95
-
96
-
97
-
98
-
99
-
100
-
101
-
102
-
103
-
104
-
105
-
106
-
107
-
108
-
109
-
110
-
111
-
112
-
113
-
114
-
115
-
116
-
117
-
118
-
119
-
120
-
121
-
122
-
123
-
124
-
125
-
126
-
127
-
128
-
129
-
130
-
131
-
132
-
133
-
134
-
135
-
136
-
137
-
138
-
139
-
140
-
141
-
142
-
143
-
144
-
145
-
146
-
147
-
148
-
149
-
150
-
151
-
152
-
153
-
154
-
155
-
156
-
157
-
158
-
159
-
160
-
161
-
162
-
163
-
164
-
165
-
166
-
167
-
168
-
169
-
170
-
171
-
172
-
173
-
174
-
175
-
176
-
177
-
178
-
179
-
180
-
181
-
182
-
183
-
184
-
185
-
186
-
187
-
188
-
189
-
190
-
191
-
192
-
193
-
194
-
195
-
196
-
197
-
198
-
199
-
200
-
201
-
202
-
203
-
204
-
205
-
206
-
207
-
208
-
209
-
210
-
211
-
212
-
213
-
214
-
215
-
216
-
217
-
218
-
219
-
220
-
221
-
222
-
223
-
224
-
225
-
226
-
227
-
228
-
229
-
230
-
231
-
232
-
233
-
234
-
235
-
236
-
237
-
238
-
239
-
240
-
241
-
242
-
243
-
244
-
245
-
246
-
247
-
248
-
249
-
250
-
251
-
252
-
253
-
254
-
255
-
256
-
257
-
258
-
259
-
260
-
261
-
262
-
263
-
264
-
265
-
266
-
267
-
268
-
269
-
270
-
271
-
272
-
273
-
274
-
275
-
276
-
277
-
278
-
279
-
280
-
281
-
282
-
283
-
284
-
285
-
286
-
287
-
288
-
289
-
290
-
291
-
292
-
293
-
294
-
295
-
296
-
297
-
298
-
299
-
300
-
301
-
302
-
303
-
304
-
305
-
306
-
307
-
308
-
309
-
310
-
311
-
312
-
313
-
314
-
315
-
316
-
317
-
318
-
319
-
320
-
321
-
322
-
323
-
324
-
325
-
326
-
327
-
328
-
329
-
330
-
331
-
332
-
333
-
334
-
335
-
336
-
337
-
338
-
339
-
340
-
341
-
342
-
343
-
344
-
345
-
346
-
347
-
348
-
349
-
350
-
351
-
352
-
 353
353 -
 354
354 -
 355
355 -
 356
356 -
 357
357 -
 358
358 -
 359
359 -
 360
360 -
 361
361 -
 362
362 -
 363
363 -
 364
364 -
 365
365 -
 366
366 -
 367
367 -
 368
368 -
 369
369 -
 370
370 -
 371
371 -
 372
372 -
 373
373 -
374
-
375
-
376
-
377
-
378
-
379
-
380
-
381
-
382
-
383
-
384
-
385
-
386
-
387
-
388
-
389
-
390
-
391
-
392
-
393
-
394
-
395
-
396
 |
 |

361
Overview Operating & Financial Review Governance Financial Statements Shareholder Information
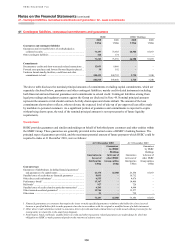
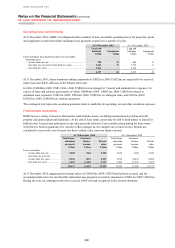
Operating lease receivables
HSBC leases a variety of different assets to third parties under operating lease arrangements, including transport
assets, property and general plant and machinery.
At 31 December 2010 At 31 December 2009
Land and
buildings Equipment
Land and
buildings Equipment
US$m US$m US$m US$m
Future minimum lease payments under
non-cancellable operating leases:
– no later than one year ........................................................... 18 17 37 857
– later than one year and no later than five years ................... 21 22 21 917
– later than five years .............................................................. 14 2 23 447
53 41 81 2,221
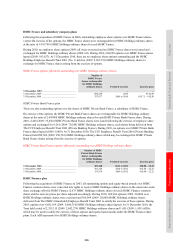
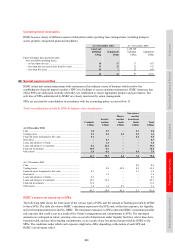
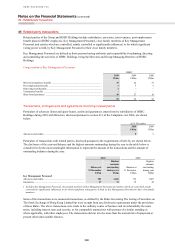
43 Special purpose entities
HSBC enters into certain transactions with customers in the ordinary course of business which involve the
establishment of special purpose entities (‘SPE’s) to facilitate or secure customer transactions. HSBC structures that
utilise SPEs are authorised centrally when they are established to ensure appropriate purpose and governance. The
activities of SPEs administered by HSBC are closely monitored by senior management.
SPEs are assessed for consolidation in accordance with the accounting policy set out in Note 1f.
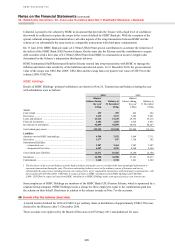
Total consolidated assets held by SPEs by balance sheet classification
Conduits
Securit-
isations
Money
market
funds
Non-money
market
investment
funds Total
US$bn US$bn US$bn US$bn US$bn
At 31 December 2010
Cash ...................................................................................... 1.0 0.7 – 0.3 2.0
Trading assets ....................................................................... 0.1 0.6 0.4 0.5 1.6
Financial assets designated at fair value ............................... 0.1 – – 6.4 6.5
Derivatives ............................................................................ – 0.3 – – 0.3
Loans and advances to banks ............................................... – 1.4 – – 1.4
Loans and advances to customers ........................................ 8.4 22.2 – – 30.6
Financial investments ........................................................... 30.5 0.1 – – 30.6
Other assets ........................................................................... 1.6 0.4 – 0.4 2.4
41.7 25.7 0.4 7.6 75.4
At 31 December 2009
Cash ...................................................................................... – – – 0.2 0.2
Trading assets ....................................................................... – 0.9 42.8 0.2 43.9
Financial assets designated at fair value .............................. 0.1 – – 5.3 5.4
Derivatives ............................................................................ – 1.2 – – 1.2
Loans and advances to banks ............................................... 0.3 – – – 0.3
Loans and advances to customers ........................................ 10.3 35.4 – – 45.7
Financial investments ........................................................... 31.4 – – – 31.4
Other assets ........................................................................... 1.6 1.4 0.3 – 3.3
43.7 38.9 43.1 5.7 131.4
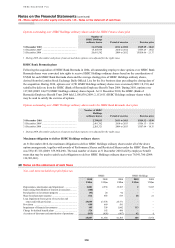
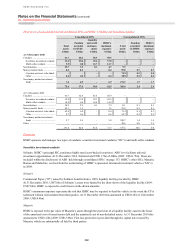
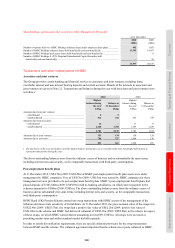
HSBC’s maximum exposure to SPEs
The following table shows the total assets of the various types of SPEs and the amount of funding provided by HSBC
to these SPEs. The table also shows HSBC’s maximum exposure to the SPEs and, within that exposure, the liquidity
and credit enhancements provided by HSBC. The maximum exposures to SPEs represent HSBC’s maximum possible
risk exposure that could occur as a result of the Group’s arrangements and commitments to SPEs. The maximum
amounts are contingent in nature, and may arise as a result of drawdowns under liquidity facilities, where these have
been provided, and any other funding commitments, or as a result of any loss protection provided by HSBC to the
SPEs. The conditions under which such exposure might arise differ depending on the nature of each SPE and
HSBC’s involvement with it.