HSBC 2010 Annual Report Download - page 19
Download and view the complete annual report
Please find page 19 of the 2010 HSBC annual report below. You can navigate through the pages in the report by either clicking on the pages listed below, or by using the keyword search tool below to find specific information within the annual report.-
 1
1 -
2
-
3
-
4
-
5
-
6
-
7
-
8
-
 9
9 -
 10
10 -
 11
11 -
 12
12 -
 13
13 -
 14
14 -
 15
15 -
 16
16 -
 17
17 -
 18
18 -
 19
19 -
 20
20 -
 21
21 -
 22
22 -
 23
23 -
 24
24 -
 25
25 -
 26
26 -
 27
27 -
 28
28 -
 29
29 -
30
-
31
-
32
-
33
-
34
-
35
-
36
-
37
-
38
-
39
-
40
-
41
-
42
-
43
-
44
-
45
-
46
-
47
-
48
-
49
-
50
-
51
-
52
-
53
-
54
-
55
-
56
-
57
-
58
-
59
-
60
-
61
-
62
-
63
-
64
-
65
-
66
-
67
-
68
-
69
-
70
-
71
-
72
-
73
-
74
-
75
-
76
-
77
-
78
-
79
-
80
-
81
-
82
-
83
-
84
-
85
-
86
-
87
-
88
-
89
-
90
-
91
-
92
-
93
-
94
-
95
-
96
-
97
-
98
-
99
-
100
-
101
-
102
-
103
-
104
-
105
-
106
-
107
-
108
-
109
-
110
-
111
-
112
-
113
-
114
-
115
-
116
-
117
-
118
-
119
-
120
-
121
-
122
-
123
-
124
-
125
-
126
-
127
-
128
-
129
-
130
-
131
-
132
-
133
-
134
-
135
-
136
-
137
-
138
-
139
-
140
-
141
-
142
-
143
-
144
-
145
-
146
-
147
-
148
-
149
-
150
-
151
-
152
-
153
-
154
-
155
-
156
-
157
-
158
-
159
-
160
-
161
-
162
-
163
-
164
-
165
-
166
-
167
-
168
-
169
-
170
-
171
-
172
-
173
-
174
-
175
-
176
-
177
-
178
-
179
-
180
-
181
-
182
-
183
-
184
-
185
-
186
-
187
-
188
-
189
-
190
-
191
-
192
-
193
-
194
-
195
-
196
-
197
-
198
-
199
-
200
-
201
-
202
-
203
-
204
-
205
-
206
-
207
-
208
-
209
-
210
-
211
-
212
-
213
-
214
-
215
-
216
-
217
-
218
-
219
-
220
-
221
-
222
-
223
-
224
-
225
-
226
-
227
-
228
-
229
-
230
-
231
-
232
-
233
-
234
-
235
-
236
-
237
-
238
-
239
-
240
-
241
-
242
-
243
-
244
-
245
-
246
-
247
-
248
-
249
-
250
-
251
-
252
-
253
-
254
-
255
-
256
-
257
-
258
-
259
-
260
-
261
-
262
-
263
-
264
-
265
-
266
-
267
-
268
-
269
-
270
-
271
-
272
-
273
-
274
-
275
-
276
-
277
-
278
-
279
-
280
-
281
-
282
-
283
-
284
-
285
-
286
-
287
-
288
-
289
-
290
-
291
-
292
-
293
-
294
-
295
-
296
-
297
-
298
-
299
-
300
-
301
-
302
-
303
-
304
-
305
-
306
-
307
-
308
-
309
-
310
-
311
-
312
-
313
-
314
-
315
-
316
-
317
-
318
-
319
-
320
-
321
-
322
-
323
-
324
-
325
-
326
-
327
-
328
-
329
-
330
-
331
-
332
-
333
-
334
-
335
-
336
-
337
-
338
-
339
-
340
-
341
-
342
-
343
-
344
-
345
-
346
-
347
-
348
-
349
-
350
-
351
-
352
-
353
-
354
-
355
-
356
-
357
-
358
-
359
-
360
-
361
-
362
-
363
-
364
-
365
-
366
-
367
-
368
-
369
-
370
-
371
-
372
-
373
-
374
-
375
-
376
-
377
-
378
-
379
-
380
-
381
-
382
-
383
-
384
-
385
-
386
-
387
-
388
-
389
-
390
-
391
-
392
-
393
-
394
-
395
-
396
 |
 |

17
Overview Operating & Financial Review Governance Financial Statements Shareholder Information
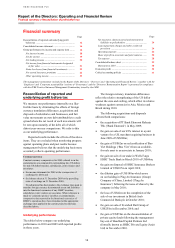
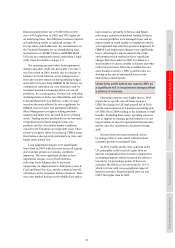
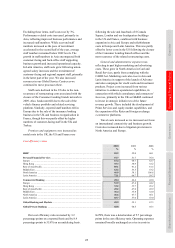
Reported profit before tax of US$19.0bn in 2010
was 169% higher than in 2009, and 36% higher on
an underlying basis. The difference between reported
and underlying results is explained on page 14.
Except where stated otherwise, the commentaries in
the Financial Summary are on an underlying basis
and references to HSBC Finance and HSBC Bank
USA are on a management basis, rather than a legal
entity basis (for details see page 37).
Net operating income before loan impairment
charges and other credit risk provisions (‘revenue’)
was lower than in 2009, notably due to a decline in
balances in North America, lower trading income
from adverse movements on non-qualifying hedges
and a fall in revenue from GB&M. In the former, we
continued to reposition our core businesses and we
remained focused on managing down our run-off
portfolios. As a consequence, revenue fell, reflecting
declining balances in the run-off portfolios and in the
Card and Retail Services business, where revenue
was also adversely affected by new regulations. In
GB&M, lower revenue was generated in Balance
Sheet Management as higher yielding positions
matured and funds were invested in lower yielding
assets. Trading income declined driven by increased
competition and reduced margins across core
products, and less favourable market conditions
caused by the European sovereign debt crisis. These
factors were partly offset by increased CMB revenue
from balance sheet growth, particularly in Asia, and
higher trade-related fees.
Loan impairment charges were significantly
lower than in 2009, with decreases across all regions
and customer groups as economic conditions
improved. The most significant decline in loan
impairment charges was in North America,
reflecting lower balances due to increased
repayments, an improvement in delinquency rates in
Card and Retail Services, and the continued run-off
of balances in the Consumer Finance business. There
were also marked declines in the Middle East and in
Latin America, primarily in Mexico and Brazil,
reflecting a reduction in personal lending balances
as selected portfolios were managed down, and an
improvement in credit quality as origination criteria
were tightened and collection practices improved. In
GB&M, loan impairment charges were significantly
lower, reflecting the improvement in the credit
environment which resulted in fewer significant
charges than those taken in 2009 in relation to a
small number of clients, notably in Europe and other
credit risk provisions fell in the available-for-sale
asset-backed securities (‘ABS’) portfolio due to a
slowing in the rate of anticipated losses in the
underlying collateral pools.
Underlying profit before tax rose by 36% as
a significant fall in impairment charges offset
a decline in revenue.
Operating expenses were higher than in 2009,
in part due to specific one-off items such as a
US$0.3bn charge for UK bank payroll tax in 2010
and the non-recurrence of a pension accounting gain
of US$0.5bn in 2009 relating to the treatment of staff
benefits. Excluding these items, operating expenses
rose in support of strategic growth initiatives in our
target markets to invest in operational infrastructure
and the selective recruitment of customer-facing
staff.
Income from associates increased, driven
by strong results in Asia which reflected robust
economic growth in mainland China.
In 2010, taxable profits were achieved in the
US, principally as the result of a gain from an
internal reorganisation that was not recognised for
accounting purposes which increased the effective
tax rate by 6.4 percentage points. If this were
excluded, the effective tax rate would be 19.1%
which is in line with our geographical range of
business activities. Reported profit after tax was
US$7.5bn higher than in 2009.