HSBC 2010 Annual Report Download - page 118
Download and view the complete annual report
Please find page 118 of the 2010 HSBC annual report below. You can navigate through the pages in the report by either clicking on the pages listed below, or by using the keyword search tool below to find specific information within the annual report.-
 1
1 -
2
-
3
-
4
-
5
-
6
-
7
-
8
-
9
-
10
-
11
-
12
-
13
-
14
-
15
-
16
-
17
-
18
-
19
-
20
-
21
-
22
-
23
-
24
-
25
-
26
-
27
-
28
-
29
-
30
-
31
-
32
-
33
-
34
-
35
-
36
-
37
-
38
-
39
-
40
-
41
-
42
-
43
-
44
-
45
-
46
-
47
-
48
-
49
-
50
-
51
-
52
-
53
-
54
-
55
-
56
-
57
-
58
-
59
-
60
-
61
-
62
-
63
-
64
-
65
-
66
-
67
-
68
-
69
-
70
-
71
-
72
-
73
-
74
-
75
-
76
-
77
-
78
-
79
-
80
-
81
-
82
-
83
-
84
-
85
-
86
-
87
-
88
-
89
-
90
-
91
-
92
-
93
-
94
-
95
-
96
-
97
-
98
-
99
-
100
-
101
-
102
-
103
-
104
-
105
-
106
-
107
-
 108
108 -
 109
109 -
 110
110 -
 111
111 -
 112
112 -
 113
113 -
 114
114 -
 115
115 -
 116
116 -
 117
117 -
 118
118 -
 119
119 -
 120
120 -
 121
121 -
 122
122 -
 123
123 -
 124
124 -
 125
125 -
 126
126 -
 127
127 -
 128
128 -
129
-
130
-
131
-
132
-
133
-
134
-
135
-
136
-
137
-
138
-
139
-
140
-
141
-
142
-
143
-
144
-
145
-
146
-
147
-
148
-
149
-
150
-
151
-
152
-
153
-
154
-
155
-
156
-
157
-
158
-
159
-
160
-
161
-
162
-
163
-
164
-
165
-
166
-
167
-
168
-
169
-
170
-
171
-
172
-
173
-
174
-
175
-
176
-
177
-
178
-
179
-
180
-
181
-
182
-
183
-
184
-
185
-
186
-
187
-
188
-
189
-
190
-
191
-
192
-
193
-
194
-
195
-
196
-
197
-
198
-
199
-
200
-
201
-
202
-
203
-
204
-
205
-
206
-
207
-
208
-
209
-
210
-
211
-
212
-
213
-
214
-
215
-
216
-
217
-
218
-
219
-
220
-
221
-
222
-
223
-
224
-
225
-
226
-
227
-
228
-
229
-
230
-
231
-
232
-
233
-
234
-
235
-
236
-
237
-
238
-
239
-
240
-
241
-
242
-
243
-
244
-
245
-
246
-
247
-
248
-
249
-
250
-
251
-
252
-
253
-
254
-
255
-
256
-
257
-
258
-
259
-
260
-
261
-
262
-
263
-
264
-
265
-
266
-
267
-
268
-
269
-
270
-
271
-
272
-
273
-
274
-
275
-
276
-
277
-
278
-
279
-
280
-
281
-
282
-
283
-
284
-
285
-
286
-
287
-
288
-
289
-
290
-
291
-
292
-
293
-
294
-
295
-
296
-
297
-
298
-
299
-
300
-
301
-
302
-
303
-
304
-
305
-
306
-
307
-
308
-
309
-
310
-
311
-
312
-
313
-
314
-
315
-
316
-
317
-
318
-
319
-
320
-
321
-
322
-
323
-
324
-
325
-
326
-
327
-
328
-
329
-
330
-
331
-
332
-
333
-
334
-
335
-
336
-
337
-
338
-
339
-
340
-
341
-
342
-
343
-
344
-
345
-
346
-
347
-
348
-
349
-
350
-
351
-
352
-
353
-
354
-
355
-
356
-
357
-
358
-
359
-
360
-
361
-
362
-
363
-
364
-
365
-
366
-
367
-
368
-
369
-
370
-
371
-
372
-
373
-
374
-
375
-
376
-
377
-
378
-
379
-
380
-
381
-
382
-
383
-
384
-
385
-
386
-
387
-
388
-
389
-
390
-
391
-
392
-
393
-
394
-
395
-
396
 |
 |

HSBC HOLDINGS PLC
Report of the Directors: Operating and Financial Review (continued)
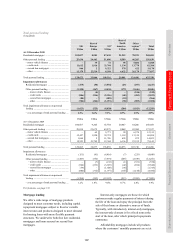
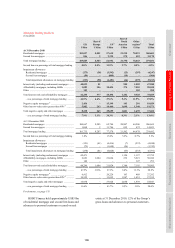
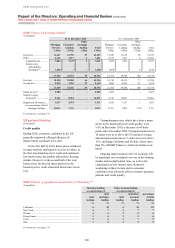
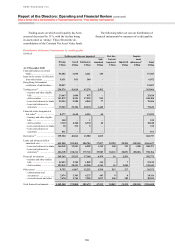
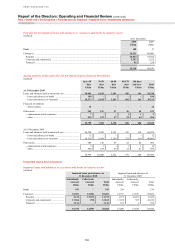
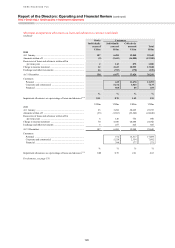
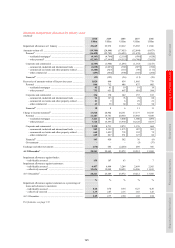
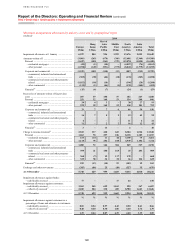
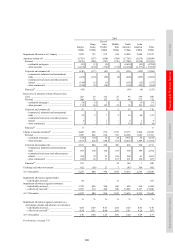
Risk > Credit risk > Credit quality > Financial instruments / Past due but not impaired
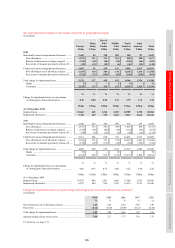
116
Trading assets on which credit quality has been
assessed decreased by 11%, with the decline being
in assets rated as ‘strong’. This reflected the de-
consolidation of the Constant Net Asset Value funds.
The following tables set out our distribution of
financial instruments by measures of credit quality:
Distribution of financial instruments by credit quality
(Audited)
Neither past due nor impaired Past due Impair-
Strong
Good Satisfactory
Sub-
standard
but not
impaired Impaired
ment
allowances27 Total
US$m US$m US$m US$m US$m US$m US$m US$m
At 31 December 2010
Cash and balances at central
banks ...................................... 51,682 3,100 2,461 140 57,383
Items in the course of collection
from other banks .................... 5,631 101 340 – 6,072
Hong Kong Government
certificates of indebtedness ... 19,057 – – – 19,057
Trading assets28 .......................... 256,576 41,620 43,278 2,492 343,966
– treasury and other eligible
bills ..................................... 23,663 1,000 957 – 25,620
– debt securities ..................... 141,837 8,254 17,222 955 168,268
– loans and advances to banks 55,534 9,980 4,865 77 70,456
– loans and advances to
customers ............................ 35,542 22,386 20,234 1,460 79,622
Financial assets designated at
fair value28 ............................. 8,377 4,640 6,536 40 19,593
– treasury and other eligible
bills ..................................... 158 – 1 – 159
– debt securities ..................... 7,310 4,368 6,530 40 18,248
– loans and advances to banks 38 272 5 – 315
– loans and advances to
customers ............................ 871 – – – 871
Derivatives28 .............................. 199,920 45,042 13,980 1,815 260,757
Loans and advances held at
amortised cost ........................ 653,248 251,265 186,704 37,057 30,320 28,284 (20,241) 1,166,637
– loans and advances to banks 166,943 33,051 6,982 1,152 108 193 (158) 208,271
– loans and advances to
customers29 ......................... 486,305 218,214 179,722 35,905 30,212 28,091 (20,083) 958,366
Financial investments ................ 345,265 23,253 17,168 4,479 16 2,591 392,772
– treasury and other similar
bills ..................................... 52,423 2,702 1,882 115 –7 57,129
– debt securities ..................... 292,842 20,551 15,286 4,364 16 2,584 335,643
Other assets ................................ 9,752 6,067 12,212 1,510 513 317 30,371
– endorsements and
acceptances ......................... 2,074 3,305 4,227 493 98 10,116
– accrued income and other .. 7,678 2,762 7,985 1,017 504 309 20,255
Total financial instruments ........ 1,549,508 375,088 282,679 47,533 30,849 31,192 (20,241) 2,296,608