HSBC 2010 Annual Report Download - page 86
Download and view the complete annual report
Please find page 86 of the 2010 HSBC annual report below. You can navigate through the pages in the report by either clicking on the pages listed below, or by using the keyword search tool below to find specific information within the annual report.-
 1
1 -
2
-
3
-
4
-
5
-
6
-
7
-
8
-
9
-
10
-
11
-
12
-
13
-
14
-
15
-
16
-
17
-
18
-
19
-
20
-
21
-
22
-
23
-
24
-
25
-
26
-
27
-
28
-
29
-
30
-
31
-
32
-
33
-
34
-
35
-
36
-
37
-
38
-
39
-
40
-
41
-
42
-
43
-
44
-
45
-
46
-
47
-
48
-
49
-
50
-
51
-
52
-
53
-
54
-
55
-
56
-
57
-
58
-
59
-
60
-
61
-
62
-
63
-
64
-
65
-
66
-
67
-
68
-
69
-
70
-
71
-
72
-
73
-
74
-
75
-
 76
76 -
 77
77 -
 78
78 -
 79
79 -
 80
80 -
 81
81 -
 82
82 -
 83
83 -
 84
84 -
 85
85 -
 86
86 -
 87
87 -
 88
88 -
 89
89 -
 90
90 -
 91
91 -
 92
92 -
 93
93 -
 94
94 -
 95
95 -
 96
96 -
97
-
98
-
99
-
100
-
101
-
102
-
103
-
104
-
105
-
106
-
107
-
108
-
109
-
110
-
111
-
112
-
113
-
114
-
115
-
116
-
117
-
118
-
119
-
120
-
121
-
122
-
123
-
124
-
125
-
126
-
127
-
128
-
129
-
130
-
131
-
132
-
133
-
134
-
135
-
136
-
137
-
138
-
139
-
140
-
141
-
142
-
143
-
144
-
145
-
146
-
147
-
148
-
149
-
150
-
151
-
152
-
153
-
154
-
155
-
156
-
157
-
158
-
159
-
160
-
161
-
162
-
163
-
164
-
165
-
166
-
167
-
168
-
169
-
170
-
171
-
172
-
173
-
174
-
175
-
176
-
177
-
178
-
179
-
180
-
181
-
182
-
183
-
184
-
185
-
186
-
187
-
188
-
189
-
190
-
191
-
192
-
193
-
194
-
195
-
196
-
197
-
198
-
199
-
200
-
201
-
202
-
203
-
204
-
205
-
206
-
207
-
208
-
209
-
210
-
211
-
212
-
213
-
214
-
215
-
216
-
217
-
218
-
219
-
220
-
221
-
222
-
223
-
224
-
225
-
226
-
227
-
228
-
229
-
230
-
231
-
232
-
233
-
234
-
235
-
236
-
237
-
238
-
239
-
240
-
241
-
242
-
243
-
244
-
245
-
246
-
247
-
248
-
249
-
250
-
251
-
252
-
253
-
254
-
255
-
256
-
257
-
258
-
259
-
260
-
261
-
262
-
263
-
264
-
265
-
266
-
267
-
268
-
269
-
270
-
271
-
272
-
273
-
274
-
275
-
276
-
277
-
278
-
279
-
280
-
281
-
282
-
283
-
284
-
285
-
286
-
287
-
288
-
289
-
290
-
291
-
292
-
293
-
294
-
295
-
296
-
297
-
298
-
299
-
300
-
301
-
302
-
303
-
304
-
305
-
306
-
307
-
308
-
309
-
310
-
311
-
312
-
313
-
314
-
315
-
316
-
317
-
318
-
319
-
320
-
321
-
322
-
323
-
324
-
325
-
326
-
327
-
328
-
329
-
330
-
331
-
332
-
333
-
334
-
335
-
336
-
337
-
338
-
339
-
340
-
341
-
342
-
343
-
344
-
345
-
346
-
347
-
348
-
349
-
350
-
351
-
352
-
353
-
354
-
355
-
356
-
357
-
358
-
359
-
360
-
361
-
362
-
363
-
364
-
365
-
366
-
367
-
368
-
369
-
370
-
371
-
372
-
373
-
374
-
375
-
376
-
377
-
378
-
379
-
380
-
381
-
382
-
383
-
384
-
385
-
386
-
387
-
388
-
389
-
390
-
391
-
392
-
393
-
394
-
395
-
396
 |
 |

HSBC HOLDINGS PLC
Report of the Directors: Operating and Financial Review (continued)
Other information > Footnotes to Overview and OFR
84
total shareholders’ equity after adding back goodwill previously written-off directly to reserves, deducting average equity preference
shares issued by HSBC Holdings and deducting/(adding) average reserves for unrealised gains/(losses) on effective cash flow hedges
and available-for-sale securities. This measure reflects capital initially invested and subsequent profit.
3 The return on average total shareholders’ equity is defined as profit attributable to shareholders of the parent company divided by
average total shareholders’ equity.
4 The cost efficiency ratio is defined as total operating expenses divided by net operating income before loan impairment charges and
other credit risk provisions.
5 Each ADS represents five ordinary shares.
6 Total shareholder return is defined as the growth in share value and declared dividend income during the relevant period.
7 The Financial Times Stock Exchange 100 Index, the Morgan Stanley Capital International World Index and the Morgan Stanley Capital
International World Bank Index.
8 HBEU is HSBC Bank plc; HBAP is The Hongkong and Shanghai Banking Corporation; and HBUS is HSBC Bank USA. Figures
provided for HSBC Bank plc and The Hongkong and Shanghai Banking Corporation incorporate the major overseas branches of these
entities. Subsidiaries of these entities are not included unless there is unrestricted transferability of liquidity between the subsidiaries
and the parent.
9 This comprises our other main banking subsidiaries and, as such, includes businesses spread across a range of locations, in many of
which we may require a higher ratio of net liquid assets to customer liabilities to reflect local market conditions.
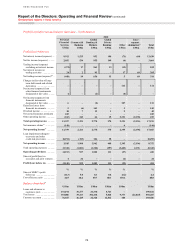
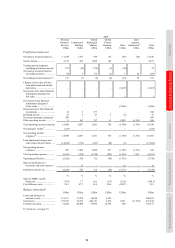
Reconciliations of reported and underlying profit/(loss) before tax
10 These columns comprise the net increments or decrements in profits in the current year compared with the previous year which are
attributable to acquisitions or disposals of subsidiaries and/or movements in fair value of own debt attributable to credit spread. The
inclusion of acquisitions and disposals is determined in the light of events each year.
11 ‘Currency translation’ is the effect of translating the results of subsidiaries and associates for the previous year at the average rates of
exchange applicable in the current year.
12 Excluding adjustments in 2009.
13 Positive numbers are favourable: negative numbers are unfavourable.
14 Changes in fair value due to movements in own credit spread on long-term debt issued. This does not include the fair value changes due
to own credit spread on structured notes issued and other hybrid instruments included within trading liabilities.
15 Net operating income before loan impairment charges and other credit risk provisions.
16 Excluding adjustments in 2008.
Financial summary
17 In 2008 an impairment charge of US$10,564m to fully write off goodwill in PFS in North America was reported in total operating
expenses. This amount is excluded from total operating expenses in calculating the ratio.
18 The effect of the bonus element of the rights issue in 2009 has been included within the basic and diluted earnings per share.
19 Dividends per ordinary share expressed as a percentage of earnings per ordinary share.
20 Net interest income includes the cost of funding trading assets, while the related external revenues are reported in trading income. In
our customer group results, the cost of funding trading assets is included with GB&M’s net trading income as interest expense.
21 Gross interest yield is the average annualised interest rate earned on average interest-earning assets (‘AIEA’).
22 Net interest spread is the difference between the average annualised interest rate earned on AIEA, net of amortised premiums and loan
fees, and the average annualised interest rate paid on average interest-bearing funds.
23 Net interest margin is net interest income expressed as an annualised percentage of AIEA.
24 Other interest-earning assets includes intercompany eliminations.
25 Interest income on trading assets is reported as ‘Net trading income’ in the consolidated income statement.
26 Interest income on financial assets designated at fair value is reported as ‘Net income from financial instruments designated at fair
value’ in the consolidated income statement.
27 This includes interest-bearing bank deposits only.
28 Interest expense on financial liabilities designated at fair value is reported as ‘Net income on financial instruments designated at fair
value’ in the consolidated income statement, other than interest on own debt which is reported in ‘Interest Expense’.
29 This includes interest-bearing customer accounts only.
30 The cost of internal funding of trading assets was US$902m (2009: US$1,309m; 2008: US$5,547m) and is excluded from the reported
‘Net trading income’ line and included in ‘Net interest income’. However, this cost is reinstated in ‘Net trading income’ in HSBC’s
customer group and global business reporting.
31 Net trading income includes income of US$23m (2009: expense of US$444m; 2008: income of US$529m), associated with changes in
the fair value of issued structured notes and other hybrid instrument liabilities derived from movements in HSBC issuance spreads.
32 Other changes in fair value include gains and losses arising from changes in the fair value of derivatives that are managed in
conjunction with HSBC’s long-term debt issued.
33 Discretionary participation features.
34 Net insurance claims incurred and movement in liabilities to policyholders arise from both life and non-life insurance business. For
non-life business, amounts reported represent the cost of claims paid during the year and the estimated cost of notified claims. For life
business, the main element of claims is the liability to policyholders created on the initial underwriting of the policy and any subsequent
movement in the liability that arises, primarily from the attribution of investment performance to savings-related policies. Consequently,
claims rise in line with increases in sales of savings-related business and with investment market growth.
Consolidated balance sheet
35 Net of impairment allowances.
36 The calculation of capital resources, capital ratios and risk-weighted assets for 2008 to 2010 is on a Basel II basis. 2006 and 2007
comparatives are on a Basel I basis.
37 Capital resources are total regulatory capital, the calculation of which is set out on page 180.
38 Includes perpetual preferred securities, details of which can be found in Note 34 on the Financial Statements.