HSBC 2010 Annual Report Download - page 129
Download and view the complete annual report
Please find page 129 of the 2010 HSBC annual report below. You can navigate through the pages in the report by either clicking on the pages listed below, or by using the keyword search tool below to find specific information within the annual report.-
 1
1 -
2
-
3
-
4
-
5
-
6
-
7
-
8
-
9
-
10
-
11
-
12
-
13
-
14
-
15
-
16
-
17
-
18
-
19
-
20
-
21
-
22
-
23
-
24
-
25
-
26
-
27
-
28
-
29
-
30
-
31
-
32
-
33
-
34
-
35
-
36
-
37
-
38
-
39
-
40
-
41
-
42
-
43
-
44
-
45
-
46
-
47
-
48
-
49
-
50
-
51
-
52
-
53
-
54
-
55
-
56
-
57
-
58
-
59
-
60
-
61
-
62
-
63
-
64
-
65
-
66
-
67
-
68
-
69
-
70
-
71
-
72
-
73
-
74
-
75
-
76
-
77
-
78
-
79
-
80
-
81
-
82
-
83
-
84
-
85
-
86
-
87
-
88
-
89
-
90
-
91
-
92
-
93
-
94
-
95
-
96
-
97
-
98
-
99
-
100
-
101
-
102
-
103
-
104
-
105
-
106
-
107
-
108
-
109
-
110
-
111
-
112
-
113
-
114
-
115
-
116
-
117
-
118
-
 119
119 -
 120
120 -
 121
121 -
 122
122 -
 123
123 -
 124
124 -
 125
125 -
 126
126 -
 127
127 -
 128
128 -
 129
129 -
 130
130 -
 131
131 -
 132
132 -
 133
133 -
 134
134 -
 135
135 -
 136
136 -
 137
137 -
 138
138 -
 139
139 -
140
-
141
-
142
-
143
-
144
-
145
-
146
-
147
-
148
-
149
-
150
-
151
-
152
-
153
-
154
-
155
-
156
-
157
-
158
-
159
-
160
-
161
-
162
-
163
-
164
-
165
-
166
-
167
-
168
-
169
-
170
-
171
-
172
-
173
-
174
-
175
-
176
-
177
-
178
-
179
-
180
-
181
-
182
-
183
-
184
-
185
-
186
-
187
-
188
-
189
-
190
-
191
-
192
-
193
-
194
-
195
-
196
-
197
-
198
-
199
-
200
-
201
-
202
-
203
-
204
-
205
-
206
-
207
-
208
-
209
-
210
-
211
-
212
-
213
-
214
-
215
-
216
-
217
-
218
-
219
-
220
-
221
-
222
-
223
-
224
-
225
-
226
-
227
-
228
-
229
-
230
-
231
-
232
-
233
-
234
-
235
-
236
-
237
-
238
-
239
-
240
-
241
-
242
-
243
-
244
-
245
-
246
-
247
-
248
-
249
-
250
-
251
-
252
-
253
-
254
-
255
-
256
-
257
-
258
-
259
-
260
-
261
-
262
-
263
-
264
-
265
-
266
-
267
-
268
-
269
-
270
-
271
-
272
-
273
-
274
-
275
-
276
-
277
-
278
-
279
-
280
-
281
-
282
-
283
-
284
-
285
-
286
-
287
-
288
-
289
-
290
-
291
-
292
-
293
-
294
-
295
-
296
-
297
-
298
-
299
-
300
-
301
-
302
-
303
-
304
-
305
-
306
-
307
-
308
-
309
-
310
-
311
-
312
-
313
-
314
-
315
-
316
-
317
-
318
-
319
-
320
-
321
-
322
-
323
-
324
-
325
-
326
-
327
-
328
-
329
-
330
-
331
-
332
-
333
-
334
-
335
-
336
-
337
-
338
-
339
-
340
-
341
-
342
-
343
-
344
-
345
-
346
-
347
-
348
-
349
-
350
-
351
-
352
-
353
-
354
-
355
-
356
-
357
-
358
-
359
-
360
-
361
-
362
-
363
-
364
-
365
-
366
-
367
-
368
-
369
-
370
-
371
-
372
-
373
-
374
-
375
-
376
-
377
-
378
-
379
-
380
-
381
-
382
-
383
-
384
-
385
-
386
-
387
-
388
-
389
-
390
-
391
-
392
-
393
-
394
-
395
-
396
 |
 |

127
Overview Operating & Financial Review Governance Financial Statements Shareholder Information
with the managing down of our exposure to higher
risk unsecured personal lending. The lower
allowances also reflected an overall improvement in
economic conditions across the region. There were
also declines in new individually assessed loan
impairment charges as new charges for 2010 were
restricted to a small number of large corporate
exposures. Impaired loans rose by 47% from
31 December 2009 to US$2.5bn due to credit
deterioration in a small number of specific
exposures, and debt restructuring in the UAE.
Releases and recoveries in the Middle East more
than doubled from 2009 to US$112m due to the
release of judgemental impairment allowances
reflecting improved economic conditions during
2010.
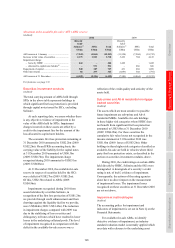
In North America, new loan impairment
allowances declined markedly, reducing by 44% to
US$8.7bn. In our HSBC Finance portfolios, lower
new loan impairment allowances in Card and Retail
Services reflected a reduction in lending balances
and an improvement in delinquency rates. In our
Consumer Lending and Mortgage Services
portfolios, new loan impairment allowances also fell
as the portfolio continued to run-off. In addition,
total loss severities on foreclosed loans improved
compared with 2009 reflecting the increase in the
number of properties for which we accepted a deed-
in-lieu of foreclosure, or a short sale, both of which
result in lower losses compared with loans which are
subjected to a formal foreclosure process.
In our corporate and commercial portfolios in
North America, new loan impairment allowances
declined, reflecting lower balances due to customer
deleveraging and improved credit quality which,
along with the improved economy, resulted in credit
upgrades on certain accounts and fewer customer
downgrades.
In North America, impaired loans decreased
by 19% from the end of 2009 to US$10.8bn, while
releases and recoveries rose by 80% compared with
2009 to US$378m.
In Latin America, new loan impairment
allowances declined by 42% to US$1.9bn, while
impaired loans declined by 23% to US$2.4bn as
economic conditions in the region improved. Lower
new loan impairment allowances in the personal
lending portfolios were due to lower credit card
balances in Mexico as we repositioned the portfolio
to target higher quality customers and, to a lesser
extent, in Brazil, due to the managed reduction in
consumer finance balances. In addition, in the
commercial lending portfolios in Brazil lower new
impairment allowances reflected an improvement
in economic conditions.
Releases and recoveries in Latin America
declined by 21% from 2009 to US$331m.
For an analysis of loan impairment charges and
other credit risk provisions by customer group, see
page 48.
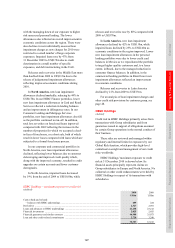
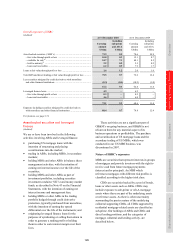
HSBC Holdings
(Audited)
Credit risk in HSBC Holdings primarily arises from
transactions with Group subsidiaries and from
guarantees issued in support of obligations assumed
by certain Group operations in the normal conduct of
their business.
These risks are reviewed and managed within
regulatory and internal limits for exposures by our
Global Risk function, which provides high-level
centralised oversight and management of our credit
risks worldwide.
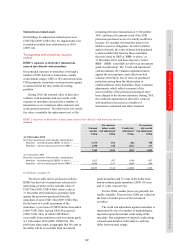
HSBC Holdings’ maximum exposure to credit
risk at 31 December 2010 is shown below. Its
financial assets principally represent claims on
Group subsidiaries in Europe and North America. No
collateral or other credit enhancements were held by
HSBC Holdings in respect of its transactions with
subsidiaries.
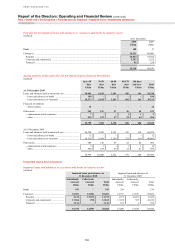
HSBC Holdings – maximum exposure to credit risk
(Audited)
2010 2009
US$m US$m
Cash at bank and in hand:
– balances with HSBC undertakings .................................................................................................... 459 224
Derivatives ................................................................................................................................................ 2,327 2,981
Loans and advances to HSBC undertakings ............................................................................................ 21,238 23,212
Financial investments ............................................................................................................................... 2,025 2,455
Financial guarantees and similar contracts .............................................................................................. 46,988 35,073
Loan and other credit-related commitments ............................................................................................ 2,720 3,240
75,757 67,185