HSBC 2010 Annual Report Download - page 296
Download and view the complete annual report
Please find page 296 of the 2010 HSBC annual report below. You can navigate through the pages in the report by either clicking on the pages listed below, or by using the keyword search tool below to find specific information within the annual report.-
 1
1 -
2
-
3
-
4
-
5
-
6
-
7
-
8
-
9
-
10
-
11
-
12
-
13
-
14
-
15
-
16
-
17
-
18
-
19
-
20
-
21
-
22
-
23
-
24
-
25
-
26
-
27
-
28
-
29
-
30
-
31
-
32
-
33
-
34
-
35
-
36
-
37
-
38
-
39
-
40
-
41
-
42
-
43
-
44
-
45
-
46
-
47
-
48
-
49
-
50
-
51
-
52
-
53
-
54
-
55
-
56
-
57
-
58
-
59
-
60
-
61
-
62
-
63
-
64
-
65
-
66
-
67
-
68
-
69
-
70
-
71
-
72
-
73
-
74
-
75
-
76
-
77
-
78
-
79
-
80
-
81
-
82
-
83
-
84
-
85
-
86
-
87
-
88
-
89
-
90
-
91
-
92
-
93
-
94
-
95
-
96
-
97
-
98
-
99
-
100
-
101
-
102
-
103
-
104
-
105
-
106
-
107
-
108
-
109
-
110
-
111
-
112
-
113
-
114
-
115
-
116
-
117
-
118
-
119
-
120
-
121
-
122
-
123
-
124
-
125
-
126
-
127
-
128
-
129
-
130
-
131
-
132
-
133
-
134
-
135
-
136
-
137
-
138
-
139
-
140
-
141
-
142
-
143
-
144
-
145
-
146
-
147
-
148
-
149
-
150
-
151
-
152
-
153
-
154
-
155
-
156
-
157
-
158
-
159
-
160
-
161
-
162
-
163
-
164
-
165
-
166
-
167
-
168
-
169
-
170
-
171
-
172
-
173
-
174
-
175
-
176
-
177
-
178
-
179
-
180
-
181
-
182
-
183
-
184
-
185
-
186
-
187
-
188
-
189
-
190
-
191
-
192
-
193
-
194
-
195
-
196
-
197
-
198
-
199
-
200
-
201
-
202
-
203
-
204
-
205
-
206
-
207
-
208
-
209
-
210
-
211
-
212
-
213
-
214
-
215
-
216
-
217
-
218
-
219
-
220
-
221
-
222
-
223
-
224
-
225
-
226
-
227
-
228
-
229
-
230
-
231
-
232
-
233
-
234
-
235
-
236
-
237
-
238
-
239
-
240
-
241
-
242
-
243
-
244
-
245
-
246
-
247
-
248
-
249
-
250
-
251
-
252
-
253
-
254
-
255
-
256
-
257
-
258
-
259
-
260
-
261
-
262
-
263
-
264
-
265
-
266
-
267
-
268
-
269
-
270
-
271
-
272
-
273
-
274
-
275
-
276
-
277
-
278
-
279
-
280
-
281
-
282
-
283
-
284
-
285
-
 286
286 -
 287
287 -
 288
288 -
 289
289 -
 290
290 -
 291
291 -
 292
292 -
 293
293 -
 294
294 -
 295
295 -
 296
296 -
 297
297 -
 298
298 -
 299
299 -
 300
300 -
 301
301 -
 302
302 -
 303
303 -
 304
304 -
 305
305 -
 306
306 -
307
-
308
-
309
-
310
-
311
-
312
-
313
-
314
-
315
-
316
-
317
-
318
-
319
-
320
-
321
-
322
-
323
-
324
-
325
-
326
-
327
-
328
-
329
-
330
-
331
-
332
-
333
-
334
-
335
-
336
-
337
-
338
-
339
-
340
-
341
-
342
-
343
-
344
-
345
-
346
-
347
-
348
-
349
-
350
-
351
-
352
-
353
-
354
-
355
-
356
-
357
-
358
-
359
-
360
-
361
-
362
-
363
-
364
-
365
-
366
-
367
-
368
-
369
-
370
-
371
-
372
-
373
-
374
-
375
-
376
-
377
-
378
-
379
-
380
-
381
-
382
-
383
-
384
-
385
-
386
-
387
-
388
-
389
-
390
-
391
-
392
-
393
-
394
-
395
-
396
 |
 |

HSBC HOLDINGS PLC
Notes on the Financial Statements (continued)
10 – Tax expense / 11 – Dividends
294
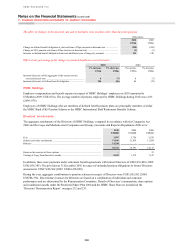
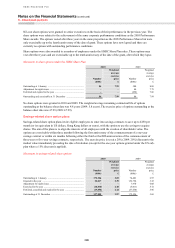
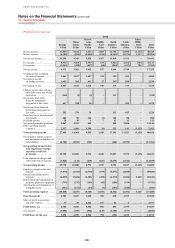
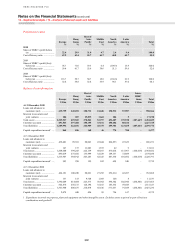
Presentation of deferred tax balances
Deferred tax balances are presented in the consolidated balance sheet after offsetting asset and liability balances
where HSBC has the legal right to set off and intends to settle on a net basis, as follows:
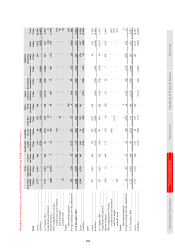
2010 2009
US$m US$m
Deferred tax assets .................................................................................................................................... 7,011 8,620
Deferred tax liabilities .............................................................................................................................. (1,093) (1,837)
5,918 6,783
Analysis of deferred tax assets by country
2010 2009
US$m US$m
US ............................................................................................................................................................. 4,043 5,110
Brazil ......................................................................................................................................................... 883 1,289
Mexico ...................................................................................................................................................... 665 620
UK ............................................................................................................................................................. 383 395
Other ......................................................................................................................................................... 1,037 1,206
7,011 8,620
The amount of temporary differences, unused tax losses and unused tax credits excluding the US, for which no
deferred tax asset is recognised in the balance sheet is US$2,473m (2009: US$1,723m). Of this amount, US$2,366m
(2009: US$1,608m) has no expiry date, US$107m (2009: US$115m) is scheduled to expire within 10 years (2009: 10
years) and the remaining will expire after 10 years. The deferred tax asset unrecognised in respect of these items is
US$601m (2009: US$491m), of which US$564m (2009: US$450m) has no expiry date, US$37m (2009: US$40m) is
scheduled to expire within 10 years (2009: 10 years) and the remaining will expire after 10 years.
In the US, the deferred tax asset unrecognised in respect of temporary differences, unused tax losses and unused tax
credits was US$1,715m (2009: US$1,577m), of which US$70m (2009: US$52m) has no expiry date, US$908m
(2009: US$932m) is scheduled to expire within 10 years (2009: 10 years) and the remaining will expire within
20 years.
The US deferred tax assets not recognised of US$1,715m (2009: US$1,577m) comprise unused state losses of
US$694m (2009: US$854m), unused federal losses of US$43m (2009: nil), unused tax credits of US$908m (2009:
US$716m) and other differences of US$70m (2009: US$7m). The gross temporary difference in respect of the
unused state losses is US$12,486m (2009: US$15,517m), the unused federal losses are US$122m (2009: nil), the
other differences are US$200m (2009: US$20m), while no gross equivalent is applied to the unused tax credits.
Deferred tax of US$89m (2009: US$94m) has been provided in respect of distributable reserves of associates that, on
distribution, would attract withholding tax.
Deferred tax is not recognised in respect of the Group’s investments in subsidiaries and branches where remittance
is not contemplated, and for those associates and interests in joint ventures where it has been determined that no
additional tax will arise. The aggregate amount of temporary differences associated with investments where no
deferred tax liability is recognised is nil (2009: nil; 2008: US$38,443m). Following the change in the UK tax
treatment of dividends on 1 July 2009, no UK tax is expected to arise on distributions from group entities and no
temporary difference exists except where withholding tax or other foreign tax could arise on the investments. No
amount is disclosed for the unrecognised deferred tax or the 2010 and 2009 temporary differences associated with
such investments, as it is impracticable to determine the amount of income taxes that would be payable when any
temporary differences reverse.
Of the total net deferred tax assets of US$7.0bn at 31 December 2010 (2009: US$8.6bn), US$4.0bn (2009:
US$5.1bn) arose in respect of HSBC’s US operations where there has been a recent history of losses. Management’s
analysis of the recognition of these deferred tax assets significantly discounts any future expected profits from the US
operations and relies to a greater extent on capital support to the US operations from HSBC Holdings plc, including
tax planning strategies implemented in relation to such support. Further to the implementation of this strategy, the
transfer of HSBC Bank Canada, which was part of the sub-group headed by HSBC North America Holdings Inc., to
HSBC Overseas Holdings (UK) Limited in an internal reorganisation on 31 January 2010, provided substantial
support for the recoverability of the US deferred tax assets. The associated taxable gain arising in the US operations