HSBC 2010 Annual Report Download - page 17
Download and view the complete annual report
Please find page 17 of the 2010 HSBC annual report below. You can navigate through the pages in the report by either clicking on the pages listed below, or by using the keyword search tool below to find specific information within the annual report.-
 1
1 -
2
-
3
-
4
-
5
-
6
-
 7
7 -
 8
8 -
 9
9 -
 10
10 -
 11
11 -
 12
12 -
 13
13 -
 14
14 -
 15
15 -
 16
16 -
 17
17 -
 18
18 -
 19
19 -
 20
20 -
 21
21 -
 22
22 -
 23
23 -
 24
24 -
 25
25 -
 26
26 -
 27
27 -
28
-
29
-
30
-
31
-
32
-
33
-
34
-
35
-
36
-
37
-
38
-
39
-
40
-
41
-
42
-
43
-
44
-
45
-
46
-
47
-
48
-
49
-
50
-
51
-
52
-
53
-
54
-
55
-
56
-
57
-
58
-
59
-
60
-
61
-
62
-
63
-
64
-
65
-
66
-
67
-
68
-
69
-
70
-
71
-
72
-
73
-
74
-
75
-
76
-
77
-
78
-
79
-
80
-
81
-
82
-
83
-
84
-
85
-
86
-
87
-
88
-
89
-
90
-
91
-
92
-
93
-
94
-
95
-
96
-
97
-
98
-
99
-
100
-
101
-
102
-
103
-
104
-
105
-
106
-
107
-
108
-
109
-
110
-
111
-
112
-
113
-
114
-
115
-
116
-
117
-
118
-
119
-
120
-
121
-
122
-
123
-
124
-
125
-
126
-
127
-
128
-
129
-
130
-
131
-
132
-
133
-
134
-
135
-
136
-
137
-
138
-
139
-
140
-
141
-
142
-
143
-
144
-
145
-
146
-
147
-
148
-
149
-
150
-
151
-
152
-
153
-
154
-
155
-
156
-
157
-
158
-
159
-
160
-
161
-
162
-
163
-
164
-
165
-
166
-
167
-
168
-
169
-
170
-
171
-
172
-
173
-
174
-
175
-
176
-
177
-
178
-
179
-
180
-
181
-
182
-
183
-
184
-
185
-
186
-
187
-
188
-
189
-
190
-
191
-
192
-
193
-
194
-
195
-
196
-
197
-
198
-
199
-
200
-
201
-
202
-
203
-
204
-
205
-
206
-
207
-
208
-
209
-
210
-
211
-
212
-
213
-
214
-
215
-
216
-
217
-
218
-
219
-
220
-
221
-
222
-
223
-
224
-
225
-
226
-
227
-
228
-
229
-
230
-
231
-
232
-
233
-
234
-
235
-
236
-
237
-
238
-
239
-
240
-
241
-
242
-
243
-
244
-
245
-
246
-
247
-
248
-
249
-
250
-
251
-
252
-
253
-
254
-
255
-
256
-
257
-
258
-
259
-
260
-
261
-
262
-
263
-
264
-
265
-
266
-
267
-
268
-
269
-
270
-
271
-
272
-
273
-
274
-
275
-
276
-
277
-
278
-
279
-
280
-
281
-
282
-
283
-
284
-
285
-
286
-
287
-
288
-
289
-
290
-
291
-
292
-
293
-
294
-
295
-
296
-
297
-
298
-
299
-
300
-
301
-
302
-
303
-
304
-
305
-
306
-
307
-
308
-
309
-
310
-
311
-
312
-
313
-
314
-
315
-
316
-
317
-
318
-
319
-
320
-
321
-
322
-
323
-
324
-
325
-
326
-
327
-
328
-
329
-
330
-
331
-
332
-
333
-
334
-
335
-
336
-
337
-
338
-
339
-
340
-
341
-
342
-
343
-
344
-
345
-
346
-
347
-
348
-
349
-
350
-
351
-
352
-
353
-
354
-
355
-
356
-
357
-
358
-
359
-
360
-
361
-
362
-
363
-
364
-
365
-
366
-
367
-
368
-
369
-
370
-
371
-
372
-
373
-
374
-
375
-
376
-
377
-
378
-
379
-
380
-
381
-
382
-
383
-
384
-
385
-
386
-
387
-
388
-
389
-
390
-
391
-
392
-
393
-
394
-
395
-
396
 |
 |

15
Overview Operating & Financial Review Governance Financial Statements Shareholder Information
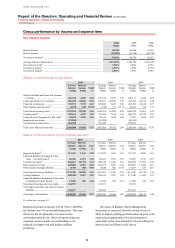
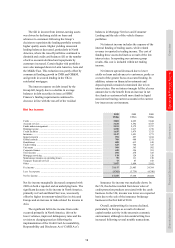
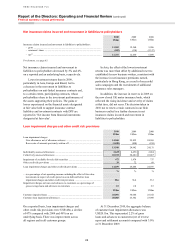
Reconciliation of reported and underlying profit before tax
2010 compared with 2009
HSBC
2009
as
reported
US$m
2009
adjust-
ments10
US$m
Currency
translation11
US$m
2009
at 2010
exchange
rates12
US$m
2010
as
reported
US$m
2010
adjust-
ments10
US$m
2010
under-
lying
US$m
Re-
ported
change13
%
Under-
lying
change13
%
Net interest income .......... 40,730 (1) 642 41,371 39,441 (31) 39,410 (3) (5)
Net fee income ................. 17,664 (210) 182 17,636 17,355 (3) 17,352 (2) (2)
Changes in fair value14 .... (6,533) 6,533 – – (63) 63 – 99 –
Other income ................... 14,320 (283) 228 14,265 11,514 (719) 10,795 (20) (24)
Net operating income15 .. 66,181 6,039 1,052 73,272 68,247 (690) 67,557 3 (8)
Loan impairment charges
and other credit risk
provisions .................... (26,488) – (330) (26,818) (14,039) – (14,039) 47 48
Net operating income .... 39,693 6,039 722 46,454 54,208 (690) 53,518 37 15
Operating expenses .......... (34,395) 200 (568) (34,763) (37,688) 19 (37,669) (10) (8)
Operating profit ............. 5,298 6,239 154 11,691 16,520 (671) 15,849 212 36
Income from associates ... 1,781 (1) 11 1,791 2,517 – 2,517 41 41
Profit before tax ............. 7,079 6,238 165 13,482 19,037 (671) 18,366 169 36
By geographical region
Europe .............................. 4,009 2,546 (152) 6,403 4,302 (164) 4,138 7 (35)
Hong Kong ...................... 5,029 1 (10) 5,020 5,692 (130) 5,562 13 11
Rest of Asia-Pacific ......... 4,200 3 205 4,408 5,902 (211) 5,691 41 29
Middle East ...................... 455 – (2) 453 892 42 934 96 106
North America ................. (7,738) 3,688 46 (4,004) 454 (208) 246
Latin America .................. 1,124 – 78 1,202 1,795 – 1,795 60 49
Profit before tax ............. 7,079 6,238 165 13,482 19,037 (671) 18,366 169 36
By customer group and
global business
Personal Financial
Services ........................ (2,065) (2) (70) (2,137) 3,518 (10) 3,508
Commercial Banking ....... 4,275 (306) 64 4,033 6,090 (133) 5,957 42 48
Global Banking and
Markets......................... 10,481 13 173 10,667 9,536 (342) 9,194 (9) (14)
Global Private Banking ... 1,108 – 1 1,109 1,054 1 1,055 (5) (5)
Other ................................. (6,720) 6,533 (3) (190) (1,161) (187) (1,348) 83 (609)
Profit before tax ............. 7,079 6,238 165 13,482 19,037 (671) 18,366 169 36
For footnotes, see page 83.
Additional information is available on the HSBC website www.hsbc.com.