HSBC 2010 Annual Report Download - page 52
Download and view the complete annual report
Please find page 52 of the 2010 HSBC annual report below. You can navigate through the pages in the report by either clicking on the pages listed below, or by using the keyword search tool below to find specific information within the annual report.-
 1
1 -
2
-
3
-
4
-
5
-
6
-
7
-
8
-
9
-
10
-
11
-
12
-
13
-
14
-
15
-
16
-
17
-
18
-
19
-
20
-
21
-
22
-
23
-
24
-
25
-
26
-
27
-
28
-
29
-
30
-
31
-
32
-
33
-
34
-
35
-
36
-
37
-
38
-
39
-
40
-
41
-
 42
42 -
 43
43 -
 44
44 -
 45
45 -
 46
46 -
 47
47 -
 48
48 -
 49
49 -
 50
50 -
 51
51 -
 52
52 -
 53
53 -
 54
54 -
 55
55 -
 56
56 -
 57
57 -
 58
58 -
 59
59 -
 60
60 -
 61
61 -
 62
62 -
63
-
64
-
65
-
66
-
67
-
68
-
69
-
70
-
71
-
72
-
73
-
74
-
75
-
76
-
77
-
78
-
79
-
80
-
81
-
82
-
83
-
84
-
85
-
86
-
87
-
88
-
89
-
90
-
91
-
92
-
93
-
94
-
95
-
96
-
97
-
98
-
99
-
100
-
101
-
102
-
103
-
104
-
105
-
106
-
107
-
108
-
109
-
110
-
111
-
112
-
113
-
114
-
115
-
116
-
117
-
118
-
119
-
120
-
121
-
122
-
123
-
124
-
125
-
126
-
127
-
128
-
129
-
130
-
131
-
132
-
133
-
134
-
135
-
136
-
137
-
138
-
139
-
140
-
141
-
142
-
143
-
144
-
145
-
146
-
147
-
148
-
149
-
150
-
151
-
152
-
153
-
154
-
155
-
156
-
157
-
158
-
159
-
160
-
161
-
162
-
163
-
164
-
165
-
166
-
167
-
168
-
169
-
170
-
171
-
172
-
173
-
174
-
175
-
176
-
177
-
178
-
179
-
180
-
181
-
182
-
183
-
184
-
185
-
186
-
187
-
188
-
189
-
190
-
191
-
192
-
193
-
194
-
195
-
196
-
197
-
198
-
199
-
200
-
201
-
202
-
203
-
204
-
205
-
206
-
207
-
208
-
209
-
210
-
211
-
212
-
213
-
214
-
215
-
216
-
217
-
218
-
219
-
220
-
221
-
222
-
223
-
224
-
225
-
226
-
227
-
228
-
229
-
230
-
231
-
232
-
233
-
234
-
235
-
236
-
237
-
238
-
239
-
240
-
241
-
242
-
243
-
244
-
245
-
246
-
247
-
248
-
249
-
250
-
251
-
252
-
253
-
254
-
255
-
256
-
257
-
258
-
259
-
260
-
261
-
262
-
263
-
264
-
265
-
266
-
267
-
268
-
269
-
270
-
271
-
272
-
273
-
274
-
275
-
276
-
277
-
278
-
279
-
280
-
281
-
282
-
283
-
284
-
285
-
286
-
287
-
288
-
289
-
290
-
291
-
292
-
293
-
294
-
295
-
296
-
297
-
298
-
299
-
300
-
301
-
302
-
303
-
304
-
305
-
306
-
307
-
308
-
309
-
310
-
311
-
312
-
313
-
314
-
315
-
316
-
317
-
318
-
319
-
320
-
321
-
322
-
323
-
324
-
325
-
326
-
327
-
328
-
329
-
330
-
331
-
332
-
333
-
334
-
335
-
336
-
337
-
338
-
339
-
340
-
341
-
342
-
343
-
344
-
345
-
346
-
347
-
348
-
349
-
350
-
351
-
352
-
353
-
354
-
355
-
356
-
357
-
358
-
359
-
360
-
361
-
362
-
363
-
364
-
365
-
366
-
367
-
368
-
369
-
370
-
371
-
372
-
373
-
374
-
375
-
376
-
377
-
378
-
379
-
380
-
381
-
382
-
383
-
384
-
385
-
386
-
387
-
388
-
389
-
390
-
391
-
392
-
393
-
394
-
395
-
396
 |
 |

HSBC HOLDINGS PLC
Report of the Directors: Operating and Financial Review (continued)
Geographical regions > Summary / Europe
50
Geographical regions
Page
Summary ....................................................................... 50
Europe ........................................................................... 51
Hong Kong ................................................................... 56
Rest of Asia-Pacific ...................................................... 60
Middle East ................................................................... 66
North America .............................................................. 71
Latin America ............................................................... 76
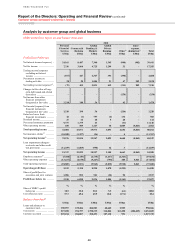
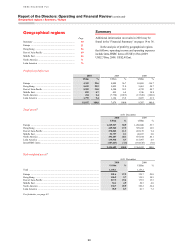
Summary
Additional information on results in 2010 may be
found in the ‘Financial Summary’ on pages 14 to 36.
In the analysis of profit by geographical regions
that follows, operating income and operating expenses
include intra-HSBC items of US$3,125m (2009:
US$2,756m; 2008: US$2,492m).
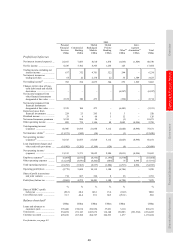
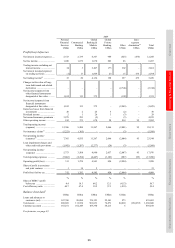
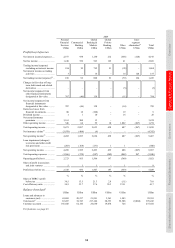
Profit/(loss) before tax
2010 2009 2008
US$m % US$m % US$m %
Europe .................................................................... 4,302 22.6 4,009 56.7 10,869 116.7
Hong Kong ............................................................ 5,692 29.9 5,029 71.0 5,461 58.7
Rest of Asia-Pacific ............................................... 5,902 31.0 4,200 59.3 4,722 50.7
Middle East ............................................................ 892 4.7 455 6.4 1,746 18.8
North America ....................................................... 454 2.4 (7,738) (109.3) (15,528) (166.8)
Latin America ........................................................ 1,795 9.4 1,124 15.9 2,037 21.9
19,037 100.0 7,079 100.0 9,307 100.0
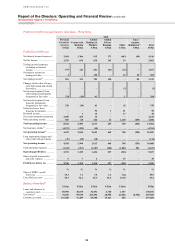
Total assets45
At 31 December
2010 2009
US$m % US$m %
Europe ..................................................................................................................... 1,249,527 50.9 1,268,600 53.7
Hong Kong ............................................................................................................. 429,565 17.5 399,243 16.9
Rest of Asia-Pacific ................................................................................................ 278,062 11.3 222,139 9.4
Middle East ............................................................................................................. 52,757 2.1 48,107 2.0
North America ........................................................................................................ 492,487 20.1 475,014 20.1
Latin America ......................................................................................................... 139,938 5.7 115,967 4.9
Intra-HSBC items ................................................................................................... (187,647) (7.6) (164,618) (7.0)
2,454,689 100.0 2,364,452 100.0
Risk-weighted assets59
At 31 December
2010 2009
US$bn % US$bn %
Total ........................................................................................................................ 1,103.1 1,133.2
Europe ..................................................................................................................... 301.6 27.2 339.7 29.8
Hong Kong ............................................................................................................. 106.9 9.7 119.5 10.5
Rest of Asia-Pacific ................................................................................................ 217.5 19.6 173.9 15.3
Middle East ............................................................................................................. 54.1 4.9 54.3 4.8
North America ........................................................................................................ 330.7 29.9 369.2 32.4
Latin America ......................................................................................................... 95.9 8.7 81.7 7.2
For footnotes, see page 83.