HSBC 2010 Annual Report Download - page 24
Download and view the complete annual report
Please find page 24 of the 2010 HSBC annual report below. You can navigate through the pages in the report by either clicking on the pages listed below, or by using the keyword search tool below to find specific information within the annual report.-
 1
1 -
2
-
3
-
4
-
5
-
6
-
7
-
8
-
9
-
10
-
11
-
12
-
13
-
 14
14 -
 15
15 -
 16
16 -
 17
17 -
 18
18 -
 19
19 -
 20
20 -
 21
21 -
 22
22 -
 23
23 -
 24
24 -
 25
25 -
 26
26 -
 27
27 -
 28
28 -
 29
29 -
 30
30 -
 31
31 -
 32
32 -
 33
33 -
 34
34 -
35
-
36
-
37
-
38
-
39
-
40
-
41
-
42
-
43
-
44
-
45
-
46
-
47
-
48
-
49
-
50
-
51
-
52
-
53
-
54
-
55
-
56
-
57
-
58
-
59
-
60
-
61
-
62
-
63
-
64
-
65
-
66
-
67
-
68
-
69
-
70
-
71
-
72
-
73
-
74
-
75
-
76
-
77
-
78
-
79
-
80
-
81
-
82
-
83
-
84
-
85
-
86
-
87
-
88
-
89
-
90
-
91
-
92
-
93
-
94
-
95
-
96
-
97
-
98
-
99
-
100
-
101
-
102
-
103
-
104
-
105
-
106
-
107
-
108
-
109
-
110
-
111
-
112
-
113
-
114
-
115
-
116
-
117
-
118
-
119
-
120
-
121
-
122
-
123
-
124
-
125
-
126
-
127
-
128
-
129
-
130
-
131
-
132
-
133
-
134
-
135
-
136
-
137
-
138
-
139
-
140
-
141
-
142
-
143
-
144
-
145
-
146
-
147
-
148
-
149
-
150
-
151
-
152
-
153
-
154
-
155
-
156
-
157
-
158
-
159
-
160
-
161
-
162
-
163
-
164
-
165
-
166
-
167
-
168
-
169
-
170
-
171
-
172
-
173
-
174
-
175
-
176
-
177
-
178
-
179
-
180
-
181
-
182
-
183
-
184
-
185
-
186
-
187
-
188
-
189
-
190
-
191
-
192
-
193
-
194
-
195
-
196
-
197
-
198
-
199
-
200
-
201
-
202
-
203
-
204
-
205
-
206
-
207
-
208
-
209
-
210
-
211
-
212
-
213
-
214
-
215
-
216
-
217
-
218
-
219
-
220
-
221
-
222
-
223
-
224
-
225
-
226
-
227
-
228
-
229
-
230
-
231
-
232
-
233
-
234
-
235
-
236
-
237
-
238
-
239
-
240
-
241
-
242
-
243
-
244
-
245
-
246
-
247
-
248
-
249
-
250
-
251
-
252
-
253
-
254
-
255
-
256
-
257
-
258
-
259
-
260
-
261
-
262
-
263
-
264
-
265
-
266
-
267
-
268
-
269
-
270
-
271
-
272
-
273
-
274
-
275
-
276
-
277
-
278
-
279
-
280
-
281
-
282
-
283
-
284
-
285
-
286
-
287
-
288
-
289
-
290
-
291
-
292
-
293
-
294
-
295
-
296
-
297
-
298
-
299
-
300
-
301
-
302
-
303
-
304
-
305
-
306
-
307
-
308
-
309
-
310
-
311
-
312
-
313
-
314
-
315
-
316
-
317
-
318
-
319
-
320
-
321
-
322
-
323
-
324
-
325
-
326
-
327
-
328
-
329
-
330
-
331
-
332
-
333
-
334
-
335
-
336
-
337
-
338
-
339
-
340
-
341
-
342
-
343
-
344
-
345
-
346
-
347
-
348
-
349
-
350
-
351
-
352
-
353
-
354
-
355
-
356
-
357
-
358
-
359
-
360
-
361
-
362
-
363
-
364
-
365
-
366
-
367
-
368
-
369
-
370
-
371
-
372
-
373
-
374
-
375
-
376
-
377
-
378
-
379
-
380
-
381
-
382
-
383
-
384
-
385
-
386
-
387
-
388
-
389
-
390
-
391
-
392
-
393
-
394
-
395
-
396
 |
 |

HSBC HOLDINGS PLC
Report of the Directors: Operating and Financial Review (continued)
Financial summary > Group performance
22
in 2010 as credit spreads widened marginally, in
contrast with a significant adverse fair value
movement in 2009. In Europe, significantly lower
adverse fair value movements were reported in 2010
as credit spreads tightened, but to a lesser extent than
in the previous year.
Income arising from financial assets held to
meet liabilities under insurance and investment
contracts reflected lower investment gains as the
growth in equity markets was less than that of 2009.
This predominantly affected the value of assets held
to support unit-linked contracts in the UK, Hong
Kong, Singapore and Brazil and participating
contracts in France.
For investment gains or losses related to assets
held to back investment contracts, the corresponding
movement in liabilities to customers is also recorded
under ‘Net income from financial instruments
designated at fair value’.
Investment gains or losses related to assets held
to back insurance contracts or investment contracts
with discretionary participation features (‘DPF’) are
offset by a corresponding change in ‘Net insurance
claims incurred and movement in liabilities to
policyholders’ to reflect the extent to which unit-
linked policyholders, in particular, participate in the
investment performance of the associated asset
portfolios.
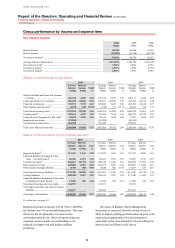
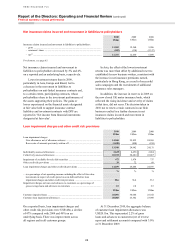
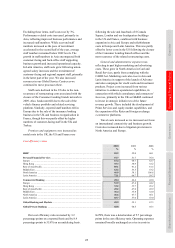
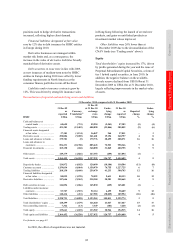
Gains less losses from financial investments
2010
US$m
2009
US$m
2008
US$m
Net gains/(losses) from disposal of:
– debt securities ...................................................................................................... 564 463 19
– equity securities ................................................................................................... 516 407 1,216
– other financial investments ................................................................................. (7) 8 4
1,073 878 1,239
Impairment of available-for-sale equity securities ..................................................... (105) (358) (1,042)
Gains less losses from financial investments ............................................................. 968 520 197
Reported gains less losses from financial
investments increased by US$448m to US$968m.
On an underlying basis, excluding an accounting
gain arising from the reclassification of Bao Viet as
an associate following our purchase of additional
shares, they increased by 69%. This was driven by
a decrease in the level of impairments on available-
for-sale equity investments as market values
improved, along with an increase in gains on the
disposal of equity and debt securities.
Impairments on equity investments declined
markedly compared with 2009 as the improving
economic situation resulted in a reduction in the
level of write-downs required on private equity and
other strategic equity investments.
Higher net gains were reported in Balance Sheet
Management on disposals of available-for-sale debt
securities, mainly in Europe and Asia. These were
partly offset by a decrease in North America, where
net gains realised from the sale of mortgage-backed
securities and other ABSs in 2009 did not recur.
Net gains on the disposal of equity securities
increased, primarily in our private equity portfolio in
Europe, as the market offered greater opportunities
for divestment. This was partly offset by the non-
recurrence of the gain on disposal of our holdings of
Visa Inc. shares in 2009.
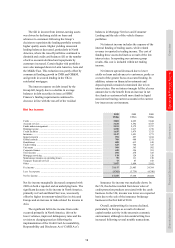
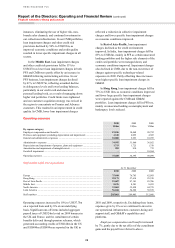
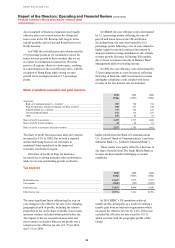
Net earned insurance premiums
2010
US$m
2009
US$m
2008
US$m
Gross insurance premium income .............................................................................. 11,609 10,991 12,547
Reinsurance premiums ............................................................................................... (463) (520) (1,697)
Net earned insurance premiums ................................................................................. 11,146 10,471 10,850
Net earned insurance premiums increased by 6% to
US$11.1bn on both a reported and an underlying
basis.
Growth was largely attributable to the continued
strong performance of life insurance products
in Asia. Successful sales campaigns and the
recruitment of additional insurance sales managers
increased net earned premiums in Hong Kong,
particularly from deferred annuity and unit-linked