HSBC 2010 Annual Report Download - page 112
Download and view the complete annual report
Please find page 112 of the 2010 HSBC annual report below. You can navigate through the pages in the report by either clicking on the pages listed below, or by using the keyword search tool below to find specific information within the annual report.-
 1
1 -
2
-
3
-
4
-
5
-
6
-
7
-
8
-
9
-
10
-
11
-
12
-
13
-
14
-
15
-
16
-
17
-
18
-
19
-
20
-
21
-
22
-
23
-
24
-
25
-
26
-
27
-
28
-
29
-
30
-
31
-
32
-
33
-
34
-
35
-
36
-
37
-
38
-
39
-
40
-
41
-
42
-
43
-
44
-
45
-
46
-
47
-
48
-
49
-
50
-
51
-
52
-
53
-
54
-
55
-
56
-
57
-
58
-
59
-
60
-
61
-
62
-
63
-
64
-
65
-
66
-
67
-
68
-
69
-
70
-
71
-
72
-
73
-
74
-
75
-
76
-
77
-
78
-
79
-
80
-
81
-
82
-
83
-
84
-
85
-
86
-
87
-
88
-
89
-
90
-
91
-
92
-
93
-
94
-
95
-
96
-
97
-
98
-
99
-
100
-
101
-
 102
102 -
 103
103 -
 104
104 -
 105
105 -
 106
106 -
 107
107 -
 108
108 -
 109
109 -
 110
110 -
 111
111 -
 112
112 -
 113
113 -
 114
114 -
 115
115 -
 116
116 -
 117
117 -
 118
118 -
 119
119 -
 120
120 -
 121
121 -
 122
122 -
123
-
124
-
125
-
126
-
127
-
128
-
129
-
130
-
131
-
132
-
133
-
134
-
135
-
136
-
137
-
138
-
139
-
140
-
141
-
142
-
143
-
144
-
145
-
146
-
147
-
148
-
149
-
150
-
151
-
152
-
153
-
154
-
155
-
156
-
157
-
158
-
159
-
160
-
161
-
162
-
163
-
164
-
165
-
166
-
167
-
168
-
169
-
170
-
171
-
172
-
173
-
174
-
175
-
176
-
177
-
178
-
179
-
180
-
181
-
182
-
183
-
184
-
185
-
186
-
187
-
188
-
189
-
190
-
191
-
192
-
193
-
194
-
195
-
196
-
197
-
198
-
199
-
200
-
201
-
202
-
203
-
204
-
205
-
206
-
207
-
208
-
209
-
210
-
211
-
212
-
213
-
214
-
215
-
216
-
217
-
218
-
219
-
220
-
221
-
222
-
223
-
224
-
225
-
226
-
227
-
228
-
229
-
230
-
231
-
232
-
233
-
234
-
235
-
236
-
237
-
238
-
239
-
240
-
241
-
242
-
243
-
244
-
245
-
246
-
247
-
248
-
249
-
250
-
251
-
252
-
253
-
254
-
255
-
256
-
257
-
258
-
259
-
260
-
261
-
262
-
263
-
264
-
265
-
266
-
267
-
268
-
269
-
270
-
271
-
272
-
273
-
274
-
275
-
276
-
277
-
278
-
279
-
280
-
281
-
282
-
283
-
284
-
285
-
286
-
287
-
288
-
289
-
290
-
291
-
292
-
293
-
294
-
295
-
296
-
297
-
298
-
299
-
300
-
301
-
302
-
303
-
304
-
305
-
306
-
307
-
308
-
309
-
310
-
311
-
312
-
313
-
314
-
315
-
316
-
317
-
318
-
319
-
320
-
321
-
322
-
323
-
324
-
325
-
326
-
327
-
328
-
329
-
330
-
331
-
332
-
333
-
334
-
335
-
336
-
337
-
338
-
339
-
340
-
341
-
342
-
343
-
344
-
345
-
346
-
347
-
348
-
349
-
350
-
351
-
352
-
353
-
354
-
355
-
356
-
357
-
358
-
359
-
360
-
361
-
362
-
363
-
364
-
365
-
366
-
367
-
368
-
369
-
370
-
371
-
372
-
373
-
374
-
375
-
376
-
377
-
378
-
379
-
380
-
381
-
382
-
383
-
384
-
385
-
386
-
387
-
388
-
389
-
390
-
391
-
392
-
393
-
394
-
395
-
396
 |
 |

HSBC HOLDINGS PLC
Report of the Directors: Operating and Financial Review (continued)
Risk > Credit risk > Areas of special interest > US personal lending
110
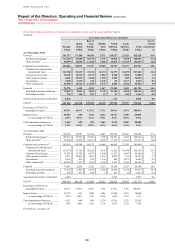
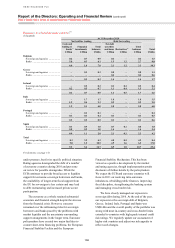
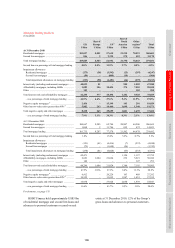
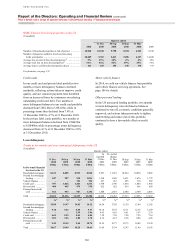
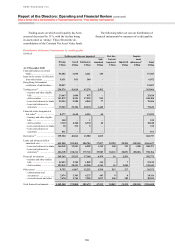
HSBC Finance US mortgage lending17
(Unaudited)
At 31 December 2010 At 31 December 2009
Mortgage
Services
Consumer
Lending
Other
mortgage
lending Total
Mortgage
Services
Consumer
Lending
Other
mortgage
lending
Total
US$m US$m US$m US$m US$m US$m US$m US$m
Fixed-rate ......................... 11,447 31,759 87 43,293 13,596 37,639 98 51,333
Other ................................ 6,122 1,517 2 7,641 8,168 1,867 6 10,041
Adjustable-rate ............ 5,042 1,517 26,561 7,070 1,867 – 8,937
Interest-only
(affordability
mortgages)18 ............ 1,080 – – 1,080 1,098 – 6
1,104
17,569 33,276 89 50,934 21,764 39,506 104 61,374
First lien ........................... 15,300 29,950 66 45,316 18,710 34,913 77 53,700
Second lien ...................... 2,269 3,326 23 5,618 3,054 4,593 27 7,674
17,569 33,276 89 50,934 21,764 39,506 104 61,374
Stated income19 ................ 2,905 – – 2,905 3,905 – – 3,905
Negative equity
mortgages15 .................. 5,161 8,910 – 14,071 6,770 12,031 – 18,801
Impairment allowances .... 1,837 2,474 – 4,311 2,419 3,167 1 5,587
– as a percentage of total
mortgage lending .... 10.5% 7.4% – 8.5% 11.1% 8.0% 1.0% 9.1%
For footnotes, see page 174.
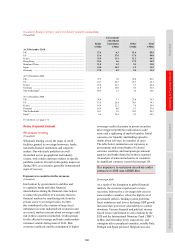
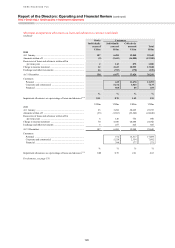
US personal lending
(Unaudited)
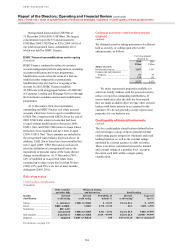
Credit quality
During 2010, economic conditions in the US
generally improved, although the pace of
improvement continued to be slow.
In the first half of 2010, house prices stabilised
in many markets and began to recover in others, as
the first time homebuyer tax credit and continued
low interest rates favourably affected the housing
market. However, in the second half of the year,
house prices declined in many markets as the
homebuyer tax credit ended and foreclosure levels
rose.
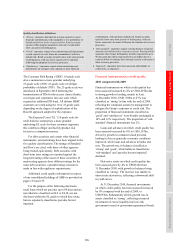
Unemployment rates, which have been a major
factor in the deterioration of credit quality, were
9.4% in December 2010, a decrease of 60 basis
points since December 2009. Unemployment rates in
18 states were at or above the US national average
and unemployment rates in 5 states were at or above
11%, including California and Florida, where more
than 5% of HSBC Finance’s total loan balances are
based.
Ongoing improvement in the US economy will
be dependent on a sustained recovery in the housing
market and unemployment rates, as well as the
continuation of low interest rates. Renewed
weakening in these factors and in consumer
confidence may adversely affect consumer payment
patterns and credit quality.
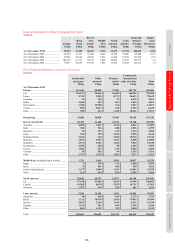
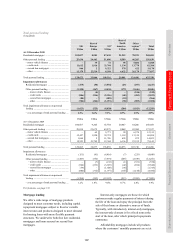
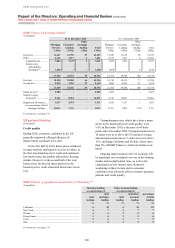
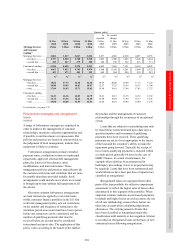
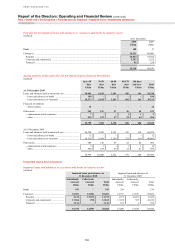
HSBC Finance: geographical concentration of US lending17, 20
(Unaudited)
Mortgage lending
as a percentage of:
Other personal lending
as a percentage of:
total
lending
total
mortgage
lending
total
lending
total other
personal
lending
percentage
of total
lending
% % % % %
California ............................................................................... 6 10 4 10 10
New York ............................................................................... 4 7 3 7 7
Florida .................................................................................... 4 6 2 5 6
Pennsylvania .......................................................................... 3 6 2 5 6
Texas ...................................................................................... 2 4 3 7 5
Ohio ....................................................................................... 3 6 2 5 5
For footnotes, see page 174.