HSBC 2010 Annual Report Download - page 364
Download and view the complete annual report
Please find page 364 of the 2010 HSBC annual report below. You can navigate through the pages in the report by either clicking on the pages listed below, or by using the keyword search tool below to find specific information within the annual report.-
 1
1 -
2
-
3
-
4
-
5
-
6
-
7
-
8
-
9
-
10
-
11
-
12
-
13
-
14
-
15
-
16
-
17
-
18
-
19
-
20
-
21
-
22
-
23
-
24
-
25
-
26
-
27
-
28
-
29
-
30
-
31
-
32
-
33
-
34
-
35
-
36
-
37
-
38
-
39
-
40
-
41
-
42
-
43
-
44
-
45
-
46
-
47
-
48
-
49
-
50
-
51
-
52
-
53
-
54
-
55
-
56
-
57
-
58
-
59
-
60
-
61
-
62
-
63
-
64
-
65
-
66
-
67
-
68
-
69
-
70
-
71
-
72
-
73
-
74
-
75
-
76
-
77
-
78
-
79
-
80
-
81
-
82
-
83
-
84
-
85
-
86
-
87
-
88
-
89
-
90
-
91
-
92
-
93
-
94
-
95
-
96
-
97
-
98
-
99
-
100
-
101
-
102
-
103
-
104
-
105
-
106
-
107
-
108
-
109
-
110
-
111
-
112
-
113
-
114
-
115
-
116
-
117
-
118
-
119
-
120
-
121
-
122
-
123
-
124
-
125
-
126
-
127
-
128
-
129
-
130
-
131
-
132
-
133
-
134
-
135
-
136
-
137
-
138
-
139
-
140
-
141
-
142
-
143
-
144
-
145
-
146
-
147
-
148
-
149
-
150
-
151
-
152
-
153
-
154
-
155
-
156
-
157
-
158
-
159
-
160
-
161
-
162
-
163
-
164
-
165
-
166
-
167
-
168
-
169
-
170
-
171
-
172
-
173
-
174
-
175
-
176
-
177
-
178
-
179
-
180
-
181
-
182
-
183
-
184
-
185
-
186
-
187
-
188
-
189
-
190
-
191
-
192
-
193
-
194
-
195
-
196
-
197
-
198
-
199
-
200
-
201
-
202
-
203
-
204
-
205
-
206
-
207
-
208
-
209
-
210
-
211
-
212
-
213
-
214
-
215
-
216
-
217
-
218
-
219
-
220
-
221
-
222
-
223
-
224
-
225
-
226
-
227
-
228
-
229
-
230
-
231
-
232
-
233
-
234
-
235
-
236
-
237
-
238
-
239
-
240
-
241
-
242
-
243
-
244
-
245
-
246
-
247
-
248
-
249
-
250
-
251
-
252
-
253
-
254
-
255
-
256
-
257
-
258
-
259
-
260
-
261
-
262
-
263
-
264
-
265
-
266
-
267
-
268
-
269
-
270
-
271
-
272
-
273
-
274
-
275
-
276
-
277
-
278
-
279
-
280
-
281
-
282
-
283
-
284
-
285
-
286
-
287
-
288
-
289
-
290
-
291
-
292
-
293
-
294
-
295
-
296
-
297
-
298
-
299
-
300
-
301
-
302
-
303
-
304
-
305
-
306
-
307
-
308
-
309
-
310
-
311
-
312
-
313
-
314
-
315
-
316
-
317
-
318
-
319
-
320
-
321
-
322
-
323
-
324
-
325
-
326
-
327
-
328
-
329
-
330
-
331
-
332
-
333
-
334
-
335
-
336
-
337
-
338
-
339
-
340
-
341
-
342
-
343
-
344
-
345
-
346
-
347
-
348
-
349
-
350
-
351
-
352
-
353
-
 354
354 -
 355
355 -
 356
356 -
 357
357 -
 358
358 -
 359
359 -
 360
360 -
 361
361 -
 362
362 -
 363
363 -
 364
364 -
 365
365 -
 366
366 -
 367
367 -
 368
368 -
 369
369 -
 370
370 -
 371
371 -
 372
372 -
 373
373 -
 374
374 -
375
-
376
-
377
-
378
-
379
-
380
-
381
-
382
-
383
-
384
-
385
-
386
-
387
-
388
-
389
-
390
-
391
-
392
-
393
-
394
-
395
-
396
 |
 |

HSBC HOLDINGS PLC
Notes on the Financial Statements (continued)
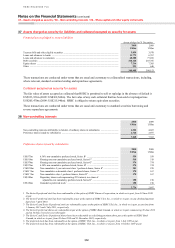
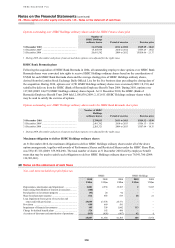
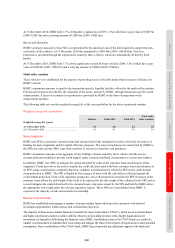
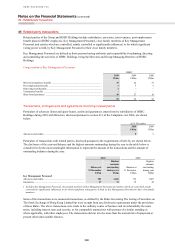
43 – Special purpose entities
362
Total assets of consolidated and unconsolidated SPEs and HSBC’s funding and maximum exposure
Consolidated SPEs Unconsolidated SPEs
Total
assets
Funding
provided
by HSBC
Liquidity
and credit
enchance-
ments
HSBC’s
maximum
exposure
Total
assets
Funding
provided
by HSBC
HSBC’s
maximum
exposure
US$bn US$bn US$bn US$bn US$bn US$bn US$bn
At 31 December 2010
Conduits ....................................... 41.7 28.6 38.3 50.5 – – –
Securities investment conduits 32.2 28.6 25.6 37.8 – – –
Multi-seller conduits ............... 9.5 0.0 12.7 12.7 – – –
Securitisations................................... 25.7 1.9 0.1 4.7 9.9 – –
Money market funds .................... 0.4 0.4 – 0.4 95.8 0.7 0.7
Constant net asset value funds – – – – 74.9 0.5 0.5
Other ........................................ 0.4 0.4 –0.4 20.9 0.2 0.2
Non-money market investment
funds ........................................ 7.6 6.9 – 6.9 274.7 1.7 1.7
75.4 37.8 38.4 62.5 380.4 2.4 2.4
At 31 December 2009
Conduits ....................................... 43.7 32.8 43.5 56.9 – – –
Securities investment conduits 32.8 32.4 29.1 42.5 – – –
Multi-seller conduits ............... 10.9 0.4 14.4 14.4 – – –
Securitisations .................................. 38.9 2.9 0.1 7.9 11.1 0.1 0.1
Money market funds .................... 43.1 1.5 – 1.5 55.9 0.3 0.3
Constant net asset value funds 42.4 0.9 – 0.9 31.2 0.1 0.1
Other ........................................ 0.7 0.6 – 0.6 24.7 0.2 0.2
Non-money market investment
funds ........................................ 5.7 5.4 – 5.4 249.7 1.4 1.4
Other ............................................ – – – – 20.6 8.8 3.2
131.4 42.6 43.6 71.7 337.3 10.6 5.0
Conduits
HSBC sponsors and manages two types of conduits: securities investment conduits (‘SIC’s) and multi-seller conduits.
Securities investment conduits
Solitaire, HSBC’s principal SIC, purchases highly rated asset-backed securities (‘ABS’s) to facilitate tailored
investment opportunities. At 31 December 2010, Solitaire held US$11.7bn of ABSs (2009: US$11.7bn). These are
included within the disclosures of ABS ‘held through consolidated SPEs’ on page 133. HSBC’s other SICs, Mazarin,
Barion and Malachite, evolved from the restructuring of HSBC’s sponsored structured investment vehicles (‘SIV’s)
in 2008.
Solitaire
Commercial Paper (‘CP’) issued by Solitaire benefits from a 100% liquidity facility provided by HSBC.
At 31 December 2010, US$7.6bn of Solitaire’s assets were funded by the draw-down of the liquidity facility (2009:
US$7.6bn). HSBC is exposed to credit losses on the drawn amounts.
HSBC’s maximum exposure represents the risk that HSBC may be required to fund the vehicle in the event the CP is
redeemed without reinvestment from third parties. At 31 December 2010 this amounted to US$16.8bn (31 December
2009: US$18.4bn).
Mazarin
HSBC is exposed to the par value of Mazarin’s assets through the provision of a liquidity facility equal to the lesser
of the amortised cost of issued senior debt and the amortised cost of non-defaulted assets. At 31 December 2010 this
amounted to US$11.6bn (2009: US$13.6bn). First loss protection is provided through the capital notes issued by
Mazarin, which are substantially all held by third parties.