HSBC 2010 Annual Report Download - page 107
Download and view the complete annual report
Please find page 107 of the 2010 HSBC annual report below. You can navigate through the pages in the report by either clicking on the pages listed below, or by using the keyword search tool below to find specific information within the annual report.-
 1
1 -
2
-
3
-
4
-
5
-
6
-
7
-
8
-
9
-
10
-
11
-
12
-
13
-
14
-
15
-
16
-
17
-
18
-
19
-
20
-
21
-
22
-
23
-
24
-
25
-
26
-
27
-
28
-
29
-
30
-
31
-
32
-
33
-
34
-
35
-
36
-
37
-
38
-
39
-
40
-
41
-
42
-
43
-
44
-
45
-
46
-
47
-
48
-
49
-
50
-
51
-
52
-
53
-
54
-
55
-
56
-
57
-
58
-
59
-
60
-
61
-
62
-
63
-
64
-
65
-
66
-
67
-
68
-
69
-
70
-
71
-
72
-
73
-
74
-
75
-
76
-
77
-
78
-
79
-
80
-
81
-
82
-
83
-
84
-
85
-
86
-
87
-
88
-
89
-
90
-
91
-
92
-
93
-
94
-
95
-
96
-
 97
97 -
 98
98 -
 99
99 -
 100
100 -
 101
101 -
 102
102 -
 103
103 -
 104
104 -
 105
105 -
 106
106 -
 107
107 -
 108
108 -
 109
109 -
 110
110 -
 111
111 -
 112
112 -
 113
113 -
 114
114 -
 115
115 -
 116
116 -
 117
117 -
118
-
119
-
120
-
121
-
122
-
123
-
124
-
125
-
126
-
127
-
128
-
129
-
130
-
131
-
132
-
133
-
134
-
135
-
136
-
137
-
138
-
139
-
140
-
141
-
142
-
143
-
144
-
145
-
146
-
147
-
148
-
149
-
150
-
151
-
152
-
153
-
154
-
155
-
156
-
157
-
158
-
159
-
160
-
161
-
162
-
163
-
164
-
165
-
166
-
167
-
168
-
169
-
170
-
171
-
172
-
173
-
174
-
175
-
176
-
177
-
178
-
179
-
180
-
181
-
182
-
183
-
184
-
185
-
186
-
187
-
188
-
189
-
190
-
191
-
192
-
193
-
194
-
195
-
196
-
197
-
198
-
199
-
200
-
201
-
202
-
203
-
204
-
205
-
206
-
207
-
208
-
209
-
210
-
211
-
212
-
213
-
214
-
215
-
216
-
217
-
218
-
219
-
220
-
221
-
222
-
223
-
224
-
225
-
226
-
227
-
228
-
229
-
230
-
231
-
232
-
233
-
234
-
235
-
236
-
237
-
238
-
239
-
240
-
241
-
242
-
243
-
244
-
245
-
246
-
247
-
248
-
249
-
250
-
251
-
252
-
253
-
254
-
255
-
256
-
257
-
258
-
259
-
260
-
261
-
262
-
263
-
264
-
265
-
266
-
267
-
268
-
269
-
270
-
271
-
272
-
273
-
274
-
275
-
276
-
277
-
278
-
279
-
280
-
281
-
282
-
283
-
284
-
285
-
286
-
287
-
288
-
289
-
290
-
291
-
292
-
293
-
294
-
295
-
296
-
297
-
298
-
299
-
300
-
301
-
302
-
303
-
304
-
305
-
306
-
307
-
308
-
309
-
310
-
311
-
312
-
313
-
314
-
315
-
316
-
317
-
318
-
319
-
320
-
321
-
322
-
323
-
324
-
325
-
326
-
327
-
328
-
329
-
330
-
331
-
332
-
333
-
334
-
335
-
336
-
337
-
338
-
339
-
340
-
341
-
342
-
343
-
344
-
345
-
346
-
347
-
348
-
349
-
350
-
351
-
352
-
353
-
354
-
355
-
356
-
357
-
358
-
359
-
360
-
361
-
362
-
363
-
364
-
365
-
366
-
367
-
368
-
369
-
370
-
371
-
372
-
373
-
374
-
375
-
376
-
377
-
378
-
379
-
380
-
381
-
382
-
383
-
384
-
385
-
386
-
387
-
388
-
389
-
390
-
391
-
392
-
393
-
394
-
395
-
396
 |
 |

105
Overview Operating & Financial Review Governance Financial Statements Shareholder Information
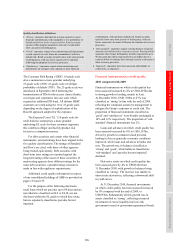
European banks
In May 2010, an FSB review indicated that European
banks would have to make additional loan impairment
charges of up to US$143bn in 2011. Following the
publication of this report, bond spreads on both
European and US banks widened. The size of the
financial sector’s exposure to sovereign debt and
doubts about economic conditions in parts of the
eurozone raised fresh concerns about banks’ credit
ratings. In addition, uncertainty over liquidity,
solvency, funding, changing regulation, capital
requirements and taxation, and speculation over the
stability of the euro, continued to cloud the future for
European banking.
The banking sector in the eurozone remains
under stress, mainly as a consequence of
governments having to finance large budget deficits,
troubles in property markets and weak credit growth.
The Ireland bailout was a direct consequence of the
failure of the Irish banking sector, largely driven by
the domestic property price crash. Worries about the
size and quality of eurozone banks’ exposure to
weaker eurozone countries are entwined with
concerns about their ability to fund themselves.
European banks share nearly three quarters of the
public and private sector debt in Belgium, Greece,
Ireland, Italy, Portugal and Spain. The regional and
local banks in the eurozone are considered more
vulnerable than well-diversified global banks.
During 2010, we were subject to the Committee
of European Banking Supervisors (now the European
Banking Authority) coordinated stress test of 91 EU
financial institutions. Banks were required to meet a
6% minimum tier 1 target under stress. We passed the
test satisfactorily, with a post-stress tier 1 ratio of
10.2% placing us in the top quartile of the institutions
tested. Further stress testing is due to take place in
2011.
We expect that the pace of reforms outlined
by various policymakers will gather speed in 2011,
most notably the Basel III proposals. These regulations
will require banks to hold more capital and a higher
quality of capital and implement new liquidity rules,
and are likely to result in a rise in the cost of funding
and put pressure on credit pricing.
We continue to closely monitor and manage
eurozone bank exposures, and are cautious in lending
to this sector. We regularly update our assessment of
higher-risk eurozone banks and adjust our risk appetite
accordingly. We also, where possible, seek to play a
positive role in maintaining credit and liquidity supply.
Middle East and North Africa
In 2009, Dubai World requested a standstill agreement
with creditors in respect of the indebtedness of certain
Dubai World group companies. The market disruption
that ensued cut would-be borrowers off from the
capital markets, although continued restructuring
efforts throughout 2010 saw the return of significant
positive sentiment from investors. As one of the long-
term bankers to Dubai World and the various entities
related to the Government of Dubai, the Group has
worked closely during 2010 to address the prevailing
issues. In October 2010, Dubai World obtained an
agreement to restructure US$25bn of its debt subject
to final documentation expected to be signed in the
first half of 2011. The arrangement extends loan
maturities for five to eight years at discounted rates,
allowing Dubai World time to sell off its non-core
assets while focusing on its core earnings. The
Group’s exposure to Dubai is primarily spread across
operating companies within the emirate.
Political developments in the region are being
monitored closely and action taken to mitigate their
impact. It is too early to foresee how events may
unfold; hitherto, our business in the region has for
the most part operated without serious disruption. In
the medium term, economic growth in the region
may be adversely affected, with wider implications
if the prices of oil, food and commodities rise
significantly.
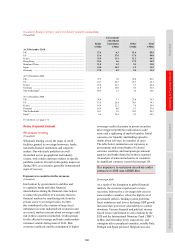
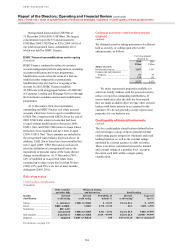
Commercial real estate
Our exposure in the commercial real estate sectors is
concentrated in the UK, North America and Hong
Kong. While there were some positive signs of
recovery in markets in the UK and the US, in part
supported by the low levels of interest rates, the
slow speed of the recovery meant that financing and
re-financing activity in the sector remained subdued.
In Hong Kong, the economy recovered robustly
and the market was relatively buoyant in 2010,
characterised by strong demand and continuing
credit appetite.
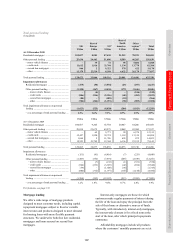
On a constant currency basis, the aggregate of
our commercial real estate and other property-related
lending of US$107bn at 31 December 2010 was 7%
higher than at 31 December 2009 and represented
11% of total loans and advances to customers. The
increase in exposure was largely in Hong Kong,
offset by a reduction in North America. In 2010,
credit quality across this sector generally showed
signs of stabilising but remained under stress in
certain markets.