HSBC 2010 Annual Report Download - page 30
Download and view the complete annual report
Please find page 30 of the 2010 HSBC annual report below. You can navigate through the pages in the report by either clicking on the pages listed below, or by using the keyword search tool below to find specific information within the annual report.-
 1
1 -
2
-
3
-
4
-
5
-
6
-
7
-
8
-
9
-
10
-
11
-
12
-
13
-
14
-
15
-
16
-
17
-
18
-
19
-
 20
20 -
 21
21 -
 22
22 -
 23
23 -
 24
24 -
 25
25 -
 26
26 -
 27
27 -
 28
28 -
 29
29 -
 30
30 -
 31
31 -
 32
32 -
 33
33 -
 34
34 -
 35
35 -
 36
36 -
 37
37 -
 38
38 -
 39
39 -
 40
40 -
41
-
42
-
43
-
44
-
45
-
46
-
47
-
48
-
49
-
50
-
51
-
52
-
53
-
54
-
55
-
56
-
57
-
58
-
59
-
60
-
61
-
62
-
63
-
64
-
65
-
66
-
67
-
68
-
69
-
70
-
71
-
72
-
73
-
74
-
75
-
76
-
77
-
78
-
79
-
80
-
81
-
82
-
83
-
84
-
85
-
86
-
87
-
88
-
89
-
90
-
91
-
92
-
93
-
94
-
95
-
96
-
97
-
98
-
99
-
100
-
101
-
102
-
103
-
104
-
105
-
106
-
107
-
108
-
109
-
110
-
111
-
112
-
113
-
114
-
115
-
116
-
117
-
118
-
119
-
120
-
121
-
122
-
123
-
124
-
125
-
126
-
127
-
128
-
129
-
130
-
131
-
132
-
133
-
134
-
135
-
136
-
137
-
138
-
139
-
140
-
141
-
142
-
143
-
144
-
145
-
146
-
147
-
148
-
149
-
150
-
151
-
152
-
153
-
154
-
155
-
156
-
157
-
158
-
159
-
160
-
161
-
162
-
163
-
164
-
165
-
166
-
167
-
168
-
169
-
170
-
171
-
172
-
173
-
174
-
175
-
176
-
177
-
178
-
179
-
180
-
181
-
182
-
183
-
184
-
185
-
186
-
187
-
188
-
189
-
190
-
191
-
192
-
193
-
194
-
195
-
196
-
197
-
198
-
199
-
200
-
201
-
202
-
203
-
204
-
205
-
206
-
207
-
208
-
209
-
210
-
211
-
212
-
213
-
214
-
215
-
216
-
217
-
218
-
219
-
220
-
221
-
222
-
223
-
224
-
225
-
226
-
227
-
228
-
229
-
230
-
231
-
232
-
233
-
234
-
235
-
236
-
237
-
238
-
239
-
240
-
241
-
242
-
243
-
244
-
245
-
246
-
247
-
248
-
249
-
250
-
251
-
252
-
253
-
254
-
255
-
256
-
257
-
258
-
259
-
260
-
261
-
262
-
263
-
264
-
265
-
266
-
267
-
268
-
269
-
270
-
271
-
272
-
273
-
274
-
275
-
276
-
277
-
278
-
279
-
280
-
281
-
282
-
283
-
284
-
285
-
286
-
287
-
288
-
289
-
290
-
291
-
292
-
293
-
294
-
295
-
296
-
297
-
298
-
299
-
300
-
301
-
302
-
303
-
304
-
305
-
306
-
307
-
308
-
309
-
310
-
311
-
312
-
313
-
314
-
315
-
316
-
317
-
318
-
319
-
320
-
321
-
322
-
323
-
324
-
325
-
326
-
327
-
328
-
329
-
330
-
331
-
332
-
333
-
334
-
335
-
336
-
337
-
338
-
339
-
340
-
341
-
342
-
343
-
344
-
345
-
346
-
347
-
348
-
349
-
350
-
351
-
352
-
353
-
354
-
355
-
356
-
357
-
358
-
359
-
360
-
361
-
362
-
363
-
364
-
365
-
366
-
367
-
368
-
369
-
370
-
371
-
372
-
373
-
374
-
375
-
376
-
377
-
378
-
379
-
380
-
381
-
382
-
383
-
384
-
385
-
386
-
387
-
388
-
389
-
390
-
391
-
392
-
393
-
394
-
395
-
396
 |
 |

HSBC HOLDINGS PLC
Report of the Directors: Operating and Financial Review (continued)
Financial summary > Group performance / Balance sheet
28
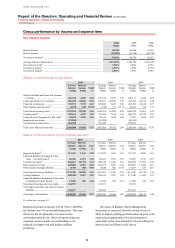
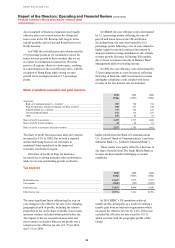
Asia in support of business expansion was broadly
offset by strict cost control across the Group and
lower costs in the US. Revenue fell, largely in the
run-off portfolio and in Card and Retail Services in
North America.
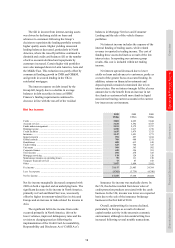
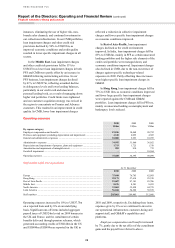
In CMB, the cost efficiency ratio deteriorated by
2.9 percentage points as we continued to invest for
future revenue growth in those markets that we see
as central to international connectivity. Revenue
grew in all regions, albeit at a slower pace, resulting
in a deterioration in the cost efficiency ratio, with the
exception of Hong Kong where strong revenue
growth led to an improvement of 1.5 percentage
points.
In GB&M, the cost efficiency ratio deteriorated
by 12.1 percentage points reflecting the one-off
payroll and bonus taxes in the UK and France.
Excluding them, the ratio deteriorated by 10.5
percentage points following a rise in costs related to
higher support costs and continued investment in
strategic initiatives being undertaken to drive future
revenue growth. Revenue fell during 2010 mainly
due to lower net interest income in Balance Sheet
Management and lower trading income.
In GPB, the cost efficiency ratio deteriorated by
5.3 percentage points as costs increased, reflecting
the hiring of front-line staff, investment in systems
and higher compliance costs coupled with lower
revenue in the low interest rate environment.
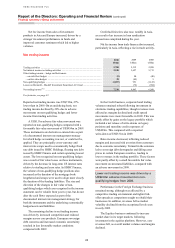
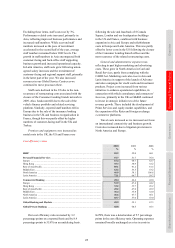
Share of profit in associates and joint ventures
2010
US$m
2009
US$m
2008
US$m
Associates
Bank of Communications Co., Limited ................................................................. 987 754 741
Ping An Insurance (Group) Company of China, Limited ..................................... 848 551 324
Industrial Bank Co., Limited .................................................................................. 327 216 221
The Saudi British Bank .......................................................................................... 161 172 251
Other ....................................................................................................................... 156 42 63
Share of profit in associates ........................................................................................ 2,479 1,735 1,600
Share of profit in joint ventures .................................................................................. 38 46 61
Share of profit in associates and joint ventures .......................................................... 2,517 1,781 1,661
The share of profit from associates and joint ventures
increased by 41% to US$2.5bn on both a reported
and an underlying basis as our associates in
mainland China capitalised on the improved
economic conditions in region.
Our share of profits in Ping An Insurance
increased due to strong insurance sales performance,
while fee income and lending growth resulted in
higher profits from the Bank of Communications
Co., Limited (‘Bank of Communciations’) and from
Industrial Bank Co., Limited (‘Industrial Bank’).
These results were partly offset by a decrease in
our share of profits from The Saudi British Bank as
revenue declined amidst challenging economic
conditions.
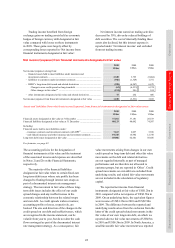
Tax expense
2010
US$m
2009
US$m
2008
US$m
Profit before tax .......................................................................................................... 19,037 7,079 9,307
Tax expense ................................................................................................................ (4,846) (385) (2,809)
Profit after tax ............................................................................................................. 14,191 6,694 6,498
Effective tax rate ......................................................................................................... 25.5%
5.4%
30.2%
The most significant factor influencing the year on
year changes to the effective tax rate is the changing
geographical split of profits, including the relative
proportion of tax on the share of profits in associates
and joint ventures included within profit before tax.
The impact of the tax on profit on associates and
joint ventures included within pre-tax profits was a
reduction in the effective tax rate of 3.7% in 2010
and 7.1% in 2009.
In 2010 HSBC’s US operations achieved
taxable profits, principally as a result of realising a
taxable gain from an internal reorganisation which
increased the effective tax rate by 6.4%. If this was
excluded the effective tax rate would be 19.1%
which is in line with the geographic profile of the
Group.