HSBC 2010 Annual Report Download - page 63
Download and view the complete annual report
Please find page 63 of the 2010 HSBC annual report below. You can navigate through the pages in the report by either clicking on the pages listed below, or by using the keyword search tool below to find specific information within the annual report.-
 1
1 -
2
-
3
-
4
-
5
-
6
-
7
-
8
-
9
-
10
-
11
-
12
-
13
-
14
-
15
-
16
-
17
-
18
-
19
-
20
-
21
-
22
-
23
-
24
-
25
-
26
-
27
-
28
-
29
-
30
-
31
-
32
-
33
-
34
-
35
-
36
-
37
-
38
-
39
-
40
-
41
-
42
-
43
-
44
-
45
-
46
-
47
-
48
-
49
-
50
-
51
-
52
-
 53
53 -
 54
54 -
 55
55 -
 56
56 -
 57
57 -
 58
58 -
 59
59 -
 60
60 -
 61
61 -
 62
62 -
 63
63 -
 64
64 -
 65
65 -
 66
66 -
 67
67 -
 68
68 -
 69
69 -
 70
70 -
 71
71 -
 72
72 -
 73
73 -
74
-
75
-
76
-
77
-
78
-
79
-
80
-
81
-
82
-
83
-
84
-
85
-
86
-
87
-
88
-
89
-
90
-
91
-
92
-
93
-
94
-
95
-
96
-
97
-
98
-
99
-
100
-
101
-
102
-
103
-
104
-
105
-
106
-
107
-
108
-
109
-
110
-
111
-
112
-
113
-
114
-
115
-
116
-
117
-
118
-
119
-
120
-
121
-
122
-
123
-
124
-
125
-
126
-
127
-
128
-
129
-
130
-
131
-
132
-
133
-
134
-
135
-
136
-
137
-
138
-
139
-
140
-
141
-
142
-
143
-
144
-
145
-
146
-
147
-
148
-
149
-
150
-
151
-
152
-
153
-
154
-
155
-
156
-
157
-
158
-
159
-
160
-
161
-
162
-
163
-
164
-
165
-
166
-
167
-
168
-
169
-
170
-
171
-
172
-
173
-
174
-
175
-
176
-
177
-
178
-
179
-
180
-
181
-
182
-
183
-
184
-
185
-
186
-
187
-
188
-
189
-
190
-
191
-
192
-
193
-
194
-
195
-
196
-
197
-
198
-
199
-
200
-
201
-
202
-
203
-
204
-
205
-
206
-
207
-
208
-
209
-
210
-
211
-
212
-
213
-
214
-
215
-
216
-
217
-
218
-
219
-
220
-
221
-
222
-
223
-
224
-
225
-
226
-
227
-
228
-
229
-
230
-
231
-
232
-
233
-
234
-
235
-
236
-
237
-
238
-
239
-
240
-
241
-
242
-
243
-
244
-
245
-
246
-
247
-
248
-
249
-
250
-
251
-
252
-
253
-
254
-
255
-
256
-
257
-
258
-
259
-
260
-
261
-
262
-
263
-
264
-
265
-
266
-
267
-
268
-
269
-
270
-
271
-
272
-
273
-
274
-
275
-
276
-
277
-
278
-
279
-
280
-
281
-
282
-
283
-
284
-
285
-
286
-
287
-
288
-
289
-
290
-
291
-
292
-
293
-
294
-
295
-
296
-
297
-
298
-
299
-
300
-
301
-
302
-
303
-
304
-
305
-
306
-
307
-
308
-
309
-
310
-
311
-
312
-
313
-
314
-
315
-
316
-
317
-
318
-
319
-
320
-
321
-
322
-
323
-
324
-
325
-
326
-
327
-
328
-
329
-
330
-
331
-
332
-
333
-
334
-
335
-
336
-
337
-
338
-
339
-
340
-
341
-
342
-
343
-
344
-
345
-
346
-
347
-
348
-
349
-
350
-
351
-
352
-
353
-
354
-
355
-
356
-
357
-
358
-
359
-
360
-
361
-
362
-
363
-
364
-
365
-
366
-
367
-
368
-
369
-
370
-
371
-
372
-
373
-
374
-
375
-
376
-
377
-
378
-
379
-
380
-
381
-
382
-
383
-
384
-
385
-
386
-
387
-
388
-
389
-
390
-
391
-
392
-
393
-
394
-
395
-
396
 |
 |

61
Overview Operating & Financial Review Governance Financial Statements Shareholder Information
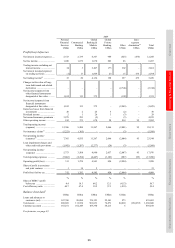
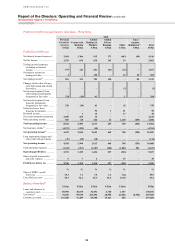
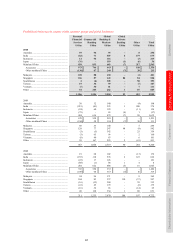
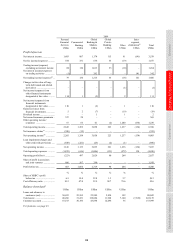
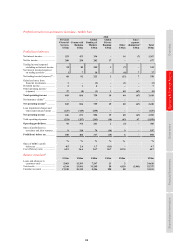
Profit/(loss) before tax by country within customer groups and global businesses
Personal
Financial
Services
US$m
Commercial
Banking
US$m
Global
Banking &
Markets
US$m
Global
Private
Banking
US$m
Other
US$m
Total
US$m
2010
Australia ............................................................ 59 96 95 – 8 258
India .................................................................. (82) 71 507 4 179 679
Indonesia ........................................................... 12 94 116 – (3) 219
Japan ................................................................. (76) – 119 (1) (6) 36
Mainland China ................................................ 839 833 683 (7) 217 2,565
Associates ..................................................... 973 746 443 – 188 2,350
Other mainland China .................................. (134) 87 240 (7) 29 215
Malaysia ............................................................ 120 88 194 – (1) 401
Singapore .......................................................... 126 87 143 84 84 524
South Korea ...................................................... 2 (4) 305 – 50 353
Taiwan .............................................................. 19 36 99 – (7) 147
Vietnam.............................................................. (7) 50 61 – 7 111
Other ................................................................. 54 205 262 1 87 609
1,066 1,556 2,584 81 615 5,902
2009
Australia ............................................................ 30 32 140 – (4) 198
India .................................................................. (219) (41) 393 1 240 374
Indonesia ........................................................... (24) 60 129 – (11) 154
Japan ................................................................. (79) – 65 (4) 1 (17)
Mainland China ................................................ 494 616 479 (7) 50 1,632
Associates ..................................................... 678 558 285 – – 1,521
Other mainland China .................................. (184) 58 194 (7) 50 111
Malaysia ............................................................ 88 53 140 – 5 286
Singapore .......................................................... 129 77 247 98 (9) 542
South Korea ...................................................... (3) (5) 342 – 25 359
Taiwan .............................................................. (3) 65 96 – 2 160
Vietnam.............................................................. (8) 40 63 – 6 101
Other ................................................................. 58 167 225 2 (41) 411
463 1,064 2,319 90 264 4,200
2008
Australia ............................................................ 19 68 102 – (13) 176
India .................................................................. (155) 118 578 2 123 666
Indonesia ........................................................... (22) 17 126 – – 121
Japan ................................................................. (88) (1) 88 1 4 4
Mainland China ................................................ 284 622 688 (5) 16 1,605
Associates ..................................................... 393 558 335 – – 1,286
Other mainland China .................................. (109) 64 353 (5) 16 319
Malaysia ............................................................ 94 96 171 – 8 369
Singapore .......................................................... 104 83 337 110 (37) 597
South Korea ...................................................... (16) (13) 304 – 38 313
Taiwan .............................................................. (41) 45 179 – (8) 175
Vietnam.............................................................. (16) 32 63 – (14) 65
Other ................................................................. 48 168 334 1 80 631
211 1,235 2,970 109 197 4,722