HSBC 2010 Annual Report Download - page 280
Download and view the complete annual report
Please find page 280 of the 2010 HSBC annual report below. You can navigate through the pages in the report by either clicking on the pages listed below, or by using the keyword search tool below to find specific information within the annual report.-
 1
1 -
2
-
3
-
4
-
5
-
6
-
7
-
8
-
9
-
10
-
11
-
12
-
13
-
14
-
15
-
16
-
17
-
18
-
19
-
20
-
21
-
22
-
23
-
24
-
25
-
26
-
27
-
28
-
29
-
30
-
31
-
32
-
33
-
34
-
35
-
36
-
37
-
38
-
39
-
40
-
41
-
42
-
43
-
44
-
45
-
46
-
47
-
48
-
49
-
50
-
51
-
52
-
53
-
54
-
55
-
56
-
57
-
58
-
59
-
60
-
61
-
62
-
63
-
64
-
65
-
66
-
67
-
68
-
69
-
70
-
71
-
72
-
73
-
74
-
75
-
76
-
77
-
78
-
79
-
80
-
81
-
82
-
83
-
84
-
85
-
86
-
87
-
88
-
89
-
90
-
91
-
92
-
93
-
94
-
95
-
96
-
97
-
98
-
99
-
100
-
101
-
102
-
103
-
104
-
105
-
106
-
107
-
108
-
109
-
110
-
111
-
112
-
113
-
114
-
115
-
116
-
117
-
118
-
119
-
120
-
121
-
122
-
123
-
124
-
125
-
126
-
127
-
128
-
129
-
130
-
131
-
132
-
133
-
134
-
135
-
136
-
137
-
138
-
139
-
140
-
141
-
142
-
143
-
144
-
145
-
146
-
147
-
148
-
149
-
150
-
151
-
152
-
153
-
154
-
155
-
156
-
157
-
158
-
159
-
160
-
161
-
162
-
163
-
164
-
165
-
166
-
167
-
168
-
169
-
170
-
171
-
172
-
173
-
174
-
175
-
176
-
177
-
178
-
179
-
180
-
181
-
182
-
183
-
184
-
185
-
186
-
187
-
188
-
189
-
190
-
191
-
192
-
193
-
194
-
195
-
196
-
197
-
198
-
199
-
200
-
201
-
202
-
203
-
204
-
205
-
206
-
207
-
208
-
209
-
210
-
211
-
212
-
213
-
214
-
215
-
216
-
217
-
218
-
219
-
220
-
221
-
222
-
223
-
224
-
225
-
226
-
227
-
228
-
229
-
230
-
231
-
232
-
233
-
234
-
235
-
236
-
237
-
238
-
239
-
240
-
241
-
242
-
243
-
244
-
245
-
246
-
247
-
248
-
249
-
250
-
251
-
252
-
253
-
254
-
255
-
256
-
257
-
258
-
259
-
260
-
261
-
262
-
263
-
264
-
265
-
266
-
267
-
268
-
269
-
 270
270 -
 271
271 -
 272
272 -
 273
273 -
 274
274 -
 275
275 -
 276
276 -
 277
277 -
 278
278 -
 279
279 -
 280
280 -
 281
281 -
 282
282 -
 283
283 -
 284
284 -
 285
285 -
 286
286 -
 287
287 -
 288
288 -
 289
289 -
 290
290 -
291
-
292
-
293
-
294
-
295
-
296
-
297
-
298
-
299
-
300
-
301
-
302
-
303
-
304
-
305
-
306
-
307
-
308
-
309
-
310
-
311
-
312
-
313
-
314
-
315
-
316
-
317
-
318
-
319
-
320
-
321
-
322
-
323
-
324
-
325
-
326
-
327
-
328
-
329
-
330
-
331
-
332
-
333
-
334
-
335
-
336
-
337
-
338
-
339
-
340
-
341
-
342
-
343
-
344
-
345
-
346
-
347
-
348
-
349
-
350
-
351
-
352
-
353
-
354
-
355
-
356
-
357
-
358
-
359
-
360
-
361
-
362
-
363
-
364
-
365
-
366
-
367
-
368
-
369
-
370
-
371
-
372
-
373
-
374
-
375
-
376
-
377
-
378
-
379
-
380
-
381
-
382
-
383
-
384
-
385
-
386
-
387
-
388
-
389
-
390
-
391
-
392
-
393
-
394
-
395
-
396
 |
 |

HSBC HOLDINGS PLC
Notes on the Financial Statements (continued)
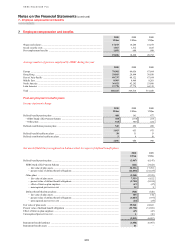
7 – Employee compensation and benefits
278
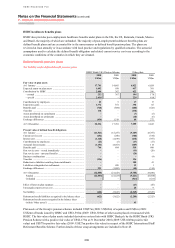
HSBC healthcare benefits plans
HSBC also provides post-employment healthcare benefits under plans in the UK, the US, Bermuda, Canada, Mexico
and Brazil, the majority of which are unfunded. The majority of post-employment healthcare benefits plans are
defined benefit plans and are accounted for in the same manner as defined benefit pension plans. The plans are
reviewed at least annually or in accordance with local practice and regulations by qualified actuaries. The actuarial
assumptions used to calculate the defined benefit obligation and related current service cost vary according to the
economic conditions of the countries in which they are situated.
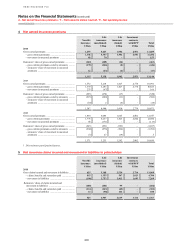
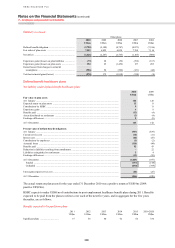
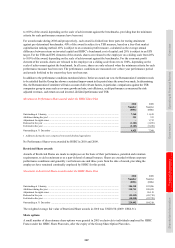
Defined benefit pension plans
Net liability under defined benefit pension plans
HSBC Bank (UK) Pension Scheme Other plans
2010 2009 2010 2009
US$m US$m US$m US$m
Fair value of plan assets
At 1 January .................................................................................. 17,701 14,865 6,822 6,024
Expected return on plan assets ..................................................... 1,092 959 437 381
Contributions by HSBC ................................................................ 2,890 367 422 596
– normal .................................................................................... 252 367 194 178
– special .................................................................................... 2,638 –228 418
Contributions by employees ......................................................... 23 5 17 17
Experience gains ........................................................................... 1,772 871 394 65
Benefits paid ................................................................................. (744) (884) (440) (522)
Transfers ....................................................................................... 136 – (136) –
Assets distributed on curtailments ................................................ – – (7) (5)
Assets distributed on settlements ................................................. – – (10) (6)
Exchange differences .................................................................... (634) 1,518 60 272
At 31 December ............................................................................ 22,236 17,701 7,559 6,822
Present value of defined benefit obligations
At 1 January .................................................................................. (21,523) (15,257) (9,109) (8,787)
Current service cost ...................................................................... (252) (260) (300) (334)
Interest cost ................................................................................... (1,148) (1,019) (438) (397)
Contributions by employees ......................................................... (23) (5) (17) (17)
Actuarial (losses)/gains ................................................................ (1,451) (4,563) (669) 114
Benefits paid ................................................................................. 744 884 518 608
Past service cost – vested immediately ........................................ – – (11) (20)
Past service cost – unvested benefits ............................................ – – (20) –
Business combinations ................................................................. – – – (4)
Transfers ....................................................................................... (136) – 136 –
Reduction in liabilities resulting from curtailments ..................... – – 158 41
Liabilities extinguished on settlements ........................................ – 499 12 1
Exchange differences .................................................................... 931 (1,802) (45) (314)
At 31 December ............................................................................ (22,858) (21,523) (9,785) (9,109)
Funded ...................................................................................... (22,858) (21,523) (9,241) (8,588)
Unfunded .................................................................................. ––(544) (521)
Effect of limit on plan surpluses ................................................... – – (47) (47)
Unrecognised past service cost ..................................................... – – 28 9
Net liability ................................................................................... (622) (3,822) (2,245) (2,325)
Retirement benefit liabilities recognised in the balance sheet ..... (622) (3,822) (2,288) (2,325)
Retirement benefit assets recognised in the balance sheet
(within ‘Other assets’) .............................................................. – – 43 –
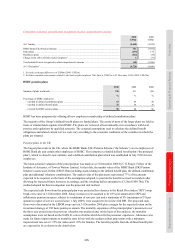
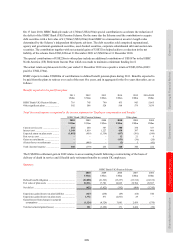
Plan assets of the Group’s pension schemes included US$57m (2009: US$62m) of equities and US$1m (2009:
US$2m) of bonds issued by HSBC and US$1,592m (2009: US$1,925m) of other assets placed or transacted with
HSBC. The fair value of plan assets included derivatives entered into with HSBC Bank plc by the HSBC Bank (UK)
Pension Scheme with a positive fair value of US$2,173m at 31 December 2010 (2009: US$1,049m positive fair
value) and US$77m positive fair value (2009: US$27m positive fair value) in respect of the HSBC International Staff
Retirement Benefits Scheme. Further details of these swap arrangements are included in Note 45.