HSBC 2010 Annual Report Download - page 100
Download and view the complete annual report
Please find page 100 of the 2010 HSBC annual report below. You can navigate through the pages in the report by either clicking on the pages listed below, or by using the keyword search tool below to find specific information within the annual report.-
 1
1 -
2
-
3
-
4
-
5
-
6
-
7
-
8
-
9
-
10
-
11
-
12
-
13
-
14
-
15
-
16
-
17
-
18
-
19
-
20
-
21
-
22
-
23
-
24
-
25
-
26
-
27
-
28
-
29
-
30
-
31
-
32
-
33
-
34
-
35
-
36
-
37
-
38
-
39
-
40
-
41
-
42
-
43
-
44
-
45
-
46
-
47
-
48
-
49
-
50
-
51
-
52
-
53
-
54
-
55
-
56
-
57
-
58
-
59
-
60
-
61
-
62
-
63
-
64
-
65
-
66
-
67
-
68
-
69
-
70
-
71
-
72
-
73
-
74
-
75
-
76
-
77
-
78
-
79
-
80
-
81
-
82
-
83
-
84
-
85
-
86
-
87
-
88
-
89
-
 90
90 -
 91
91 -
 92
92 -
 93
93 -
 94
94 -
 95
95 -
 96
96 -
 97
97 -
 98
98 -
 99
99 -
 100
100 -
 101
101 -
 102
102 -
 103
103 -
 104
104 -
 105
105 -
 106
106 -
 107
107 -
 108
108 -
 109
109 -
 110
110 -
111
-
112
-
113
-
114
-
115
-
116
-
117
-
118
-
119
-
120
-
121
-
122
-
123
-
124
-
125
-
126
-
127
-
128
-
129
-
130
-
131
-
132
-
133
-
134
-
135
-
136
-
137
-
138
-
139
-
140
-
141
-
142
-
143
-
144
-
145
-
146
-
147
-
148
-
149
-
150
-
151
-
152
-
153
-
154
-
155
-
156
-
157
-
158
-
159
-
160
-
161
-
162
-
163
-
164
-
165
-
166
-
167
-
168
-
169
-
170
-
171
-
172
-
173
-
174
-
175
-
176
-
177
-
178
-
179
-
180
-
181
-
182
-
183
-
184
-
185
-
186
-
187
-
188
-
189
-
190
-
191
-
192
-
193
-
194
-
195
-
196
-
197
-
198
-
199
-
200
-
201
-
202
-
203
-
204
-
205
-
206
-
207
-
208
-
209
-
210
-
211
-
212
-
213
-
214
-
215
-
216
-
217
-
218
-
219
-
220
-
221
-
222
-
223
-
224
-
225
-
226
-
227
-
228
-
229
-
230
-
231
-
232
-
233
-
234
-
235
-
236
-
237
-
238
-
239
-
240
-
241
-
242
-
243
-
244
-
245
-
246
-
247
-
248
-
249
-
250
-
251
-
252
-
253
-
254
-
255
-
256
-
257
-
258
-
259
-
260
-
261
-
262
-
263
-
264
-
265
-
266
-
267
-
268
-
269
-
270
-
271
-
272
-
273
-
274
-
275
-
276
-
277
-
278
-
279
-
280
-
281
-
282
-
283
-
284
-
285
-
286
-
287
-
288
-
289
-
290
-
291
-
292
-
293
-
294
-
295
-
296
-
297
-
298
-
299
-
300
-
301
-
302
-
303
-
304
-
305
-
306
-
307
-
308
-
309
-
310
-
311
-
312
-
313
-
314
-
315
-
316
-
317
-
318
-
319
-
320
-
321
-
322
-
323
-
324
-
325
-
326
-
327
-
328
-
329
-
330
-
331
-
332
-
333
-
334
-
335
-
336
-
337
-
338
-
339
-
340
-
341
-
342
-
343
-
344
-
345
-
346
-
347
-
348
-
349
-
350
-
351
-
352
-
353
-
354
-
355
-
356
-
357
-
358
-
359
-
360
-
361
-
362
-
363
-
364
-
365
-
366
-
367
-
368
-
369
-
370
-
371
-
372
-
373
-
374
-
375
-
376
-
377
-
378
-
379
-
380
-
381
-
382
-
383
-
384
-
385
-
386
-
387
-
388
-
389
-
390
-
391
-
392
-
393
-
394
-
395
-
396
 |
 |

HSBC HOLDINGS PLC
Report of the Directors: Operating and Financial Review (continued)
Risk > Credit risk > Credit exposure
98
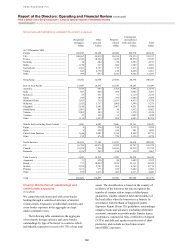
Derivatives
(Unaudited)
Derivative assets at 31 December 2010 were
US$261bn, a rise of 4% from 31 December 2009.
Our single largest exposure was to interest rate
derivatives, and this balance increased in 2010
reflecting downward shifts in yield curves, partly
offset by higher netting from increased trading with
clearing houses. The notional value of outstanding
contracts also rose, reflecting an increase in the
number of open transactions compared with 2009. In
addition our exposure to exchange rate derivatives
rose as a result of increased volatility.
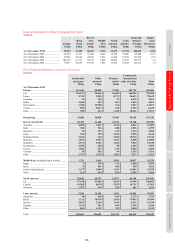
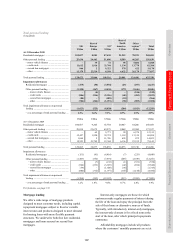
Loans and advances
(Unaudited)
On a reported basis, gross loans and advances to
customers (excluding the financial sector) at
31 December 2010 increased by US$52bn or 6%
from 31 December 2009. On a constant currency
basis the increase was 7%. The rise was primarily
due to growth in Asia, mainly in trade-related
lending and, to a lesser extent, our commercial real
estate and personal lending portfolios, as the region
prospered.
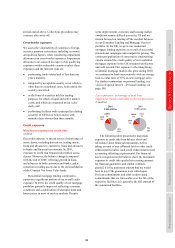
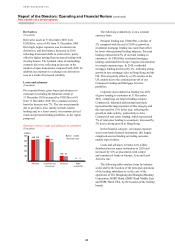
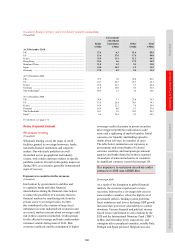
Summary of gross loans and advances to customers
(Unaudited)
425 446
102
6
434
383
97
8
0
100
200
300
400
500
Personal Corporate and
commercial
Financial ABSs
reclassified
2010 2009
(US$bn)
Reported basis
The following commentary is on a constant
currency basis:
Personal lending was US$425bn, a decline of
2% compared with the end of 2009 as growth in
residential mortgage lending was more than offset
by lower other personal lending balances. Personal
lending represented 43% of our total lending to
customers. At US$269bn, residential mortgage
lending constituted the Group’s largest concentration
in a single exposure type. In 2010, residential
mortgage lending increased by 4%, reflecting strong
growth in new mortgage sales in Hong Kong and the
UK. This was partly offset by a 12% decline in the
US, mainly due to the continued run-off of our
Consumer Lending and Mortgage Services
portfolios.
Corporate and commercial lending was 46%
of gross lending to customers at 31 December
2010, comprising our largest lending category.
Commercial, industrial and international trade
represented the largest portion of this category and
this increased by 23% in the year, reflecting the
growth in trade activity, particularly in Asia.
Commercial real estate lending, which represented
7% of total gross lending to customers, increased by
5% due to strong growth in Hong Kong.
In the financial category, our largest exposure
was to non-bank financial institutions; this largely
comprised secured lending on trading accounts,
mainly repo facilities.
Loans and advances to banks were widely
distributed across major institutions in 2010 and
increased by 16% as placements with central
and commercial banks in Europe, Asia and Latin
America rose.
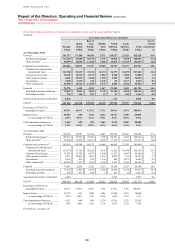
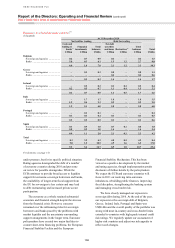
The following tables analyse loans by industry
sector and by the location of the principal operations
of the lending subsidiary or, in the case of the
operations of The Hongkong and Shanghai Banking
Corporation, HSBC Bank, HSBC Bank Middle East
and HSBC Bank USA, by the location of the lending
branch.