HSBC 2010 Annual Report Download - page 105
Download and view the complete annual report
Please find page 105 of the 2010 HSBC annual report below. You can navigate through the pages in the report by either clicking on the pages listed below, or by using the keyword search tool below to find specific information within the annual report.-
 1
1 -
2
-
3
-
4
-
5
-
6
-
7
-
8
-
9
-
10
-
11
-
12
-
13
-
14
-
15
-
16
-
17
-
18
-
19
-
20
-
21
-
22
-
23
-
24
-
25
-
26
-
27
-
28
-
29
-
30
-
31
-
32
-
33
-
34
-
35
-
36
-
37
-
38
-
39
-
40
-
41
-
42
-
43
-
44
-
45
-
46
-
47
-
48
-
49
-
50
-
51
-
52
-
53
-
54
-
55
-
56
-
57
-
58
-
59
-
60
-
61
-
62
-
63
-
64
-
65
-
66
-
67
-
68
-
69
-
70
-
71
-
72
-
73
-
74
-
75
-
76
-
77
-
78
-
79
-
80
-
81
-
82
-
83
-
84
-
85
-
86
-
87
-
88
-
89
-
90
-
91
-
92
-
93
-
94
-
 95
95 -
 96
96 -
 97
97 -
 98
98 -
 99
99 -
 100
100 -
 101
101 -
 102
102 -
 103
103 -
 104
104 -
 105
105 -
 106
106 -
 107
107 -
 108
108 -
 109
109 -
 110
110 -
 111
111 -
 112
112 -
 113
113 -
 114
114 -
 115
115 -
116
-
117
-
118
-
119
-
120
-
121
-
122
-
123
-
124
-
125
-
126
-
127
-
128
-
129
-
130
-
131
-
132
-
133
-
134
-
135
-
136
-
137
-
138
-
139
-
140
-
141
-
142
-
143
-
144
-
145
-
146
-
147
-
148
-
149
-
150
-
151
-
152
-
153
-
154
-
155
-
156
-
157
-
158
-
159
-
160
-
161
-
162
-
163
-
164
-
165
-
166
-
167
-
168
-
169
-
170
-
171
-
172
-
173
-
174
-
175
-
176
-
177
-
178
-
179
-
180
-
181
-
182
-
183
-
184
-
185
-
186
-
187
-
188
-
189
-
190
-
191
-
192
-
193
-
194
-
195
-
196
-
197
-
198
-
199
-
200
-
201
-
202
-
203
-
204
-
205
-
206
-
207
-
208
-
209
-
210
-
211
-
212
-
213
-
214
-
215
-
216
-
217
-
218
-
219
-
220
-
221
-
222
-
223
-
224
-
225
-
226
-
227
-
228
-
229
-
230
-
231
-
232
-
233
-
234
-
235
-
236
-
237
-
238
-
239
-
240
-
241
-
242
-
243
-
244
-
245
-
246
-
247
-
248
-
249
-
250
-
251
-
252
-
253
-
254
-
255
-
256
-
257
-
258
-
259
-
260
-
261
-
262
-
263
-
264
-
265
-
266
-
267
-
268
-
269
-
270
-
271
-
272
-
273
-
274
-
275
-
276
-
277
-
278
-
279
-
280
-
281
-
282
-
283
-
284
-
285
-
286
-
287
-
288
-
289
-
290
-
291
-
292
-
293
-
294
-
295
-
296
-
297
-
298
-
299
-
300
-
301
-
302
-
303
-
304
-
305
-
306
-
307
-
308
-
309
-
310
-
311
-
312
-
313
-
314
-
315
-
316
-
317
-
318
-
319
-
320
-
321
-
322
-
323
-
324
-
325
-
326
-
327
-
328
-
329
-
330
-
331
-
332
-
333
-
334
-
335
-
336
-
337
-
338
-
339
-
340
-
341
-
342
-
343
-
344
-
345
-
346
-
347
-
348
-
349
-
350
-
351
-
352
-
353
-
354
-
355
-
356
-
357
-
358
-
359
-
360
-
361
-
362
-
363
-
364
-
365
-
366
-
367
-
368
-
369
-
370
-
371
-
372
-
373
-
374
-
375
-
376
-
377
-
378
-
379
-
380
-
381
-
382
-
383
-
384
-
385
-
386
-
387
-
388
-
389
-
390
-
391
-
392
-
393
-
394
-
395
-
396
 |
 |

103
Overview Operating & Financial Review Governance Financial Statements Shareholder Information
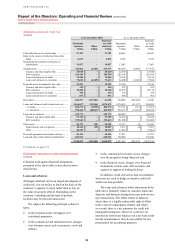
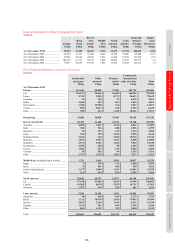
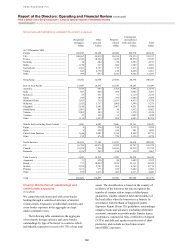
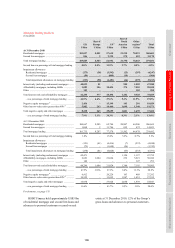
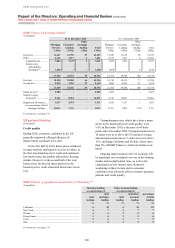
In-country foreign currency and cross-border amounts outstanding
(Unaudited)
Banks
Government
and official
institutions Other Total
US$bn US$bn US$bn US$bn
At 31 December 2010
UK ................................................................................................. 27.6 6.3 51.6 85.5
US ................................................................................................. 13.6 37.6 17.6 68.8
France ........................................................................................... 23.8 11.1 11.2 46.1
Hong Kong ................................................................................... 15.4 1.6 17.2 34.2
Mainland China ............................................................................ 21.5 1.2 9.1 31.8
Japan ............................................................................................. 14.0 16.2 1.3 31.5
Germany ....................................................................................... 17.8 4.2 9.4 31.4
At 31 December 2009
UK ................................................................................................. 37.5 7.0 38.0 82.5
US ................................................................................................. 10.7 29.3 25.7 65.7
France ........................................................................................... 27.0 10.7 7.7 45.4
Germany ....................................................................................... 21.9 15.0 4.5 41.4
The Netherlands9 .......................................................................... 10.3 1.7 7.6 19.6
At 31 December 2008
UK ................................................................................................. 38.4 7.1 33.8 79.3
US ................................................................................................. 13.6 26.4 34.1 74.1
France ........................................................................................... 19.9 12.1 7.9 39.9
Germany ....................................................................................... 18.9 8.0 6.7 33.6
The Netherlands ............................................................................ 14.1 1.9 10.3 26.3
Japan9 ............................................................................................ 2.6 19.4 2.3 24.3
For footnote, see page 174.
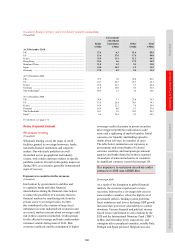
Areas of special interest
Wholesale lending
(Unaudited)
Wholesale lending covers the range of credit
facilities granted to sovereign borrowers, banks,
non-bank financial institutions and corporate
entities. Our wholesale portfolios are well
diversified across geographical and industry
sectors, with certain exposures subject to specific
portfolio controls. Overall credit quality improved
during 2010, as economies generally demonstrated
signs of recovery.
Exposures to countries in the eurozone
(Unaudited)
Intervention by governments to stabilise and
re-capitalise banks and other financial
intermediaries during the financial crisis helped
to reduce the possibility of a systemic threat to
financial markets by transferring risk from the
private sector to sovereign bodies. In 2010,
this contributed to the creation of large fiscal
imbalances in some industrialised economies and
as a result, market concerns about sovereign credit
risk in these countries intensified. Credit spreads
for the affected sovereign and bank credit markets
remained volatile during most of 2010. Risk
aversion resurfaced, and the assumption of higher
sovereign credit risk premia in private securities
prices triggered portfolio reallocation to safer
assets and a tightening of market liquidity. Initial
concerns over liquidity and funding spread to
doubts about solvency in a number of cases.
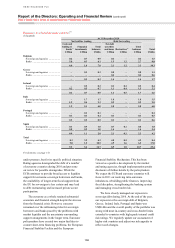
The table below summarises our exposures to
governments and central banks of selected
eurozone countries, and near/quasi government
agencies and banks domiciled in those countries.
An analysis of loans and advances to customers
by significant countries is provided on page 101.
Our exposure to eurozone countries under
pressure in 2010 was US$25.4bn.
Sovereign debt
As a result of the disruption in global financial
markets, the eurozone experienced a severe
recession, followed by a sovereign debt crisis in
some member countries, where the high level of
government deficits, banking system problems,
fiscal imbalances and low or declining GDP growth
increased their perceived vulnerability to a future
downturn. Various financial and political stresses
forced Greece and Ireland to seek a bailout by the
ECB and the International Monetary Fund (‘IMF’)
in May and November 2010, respectively, and
contagion risk to peripheral countries, notably Italy,
Portugal and Spain persisted. Belgium was also