HSBC 2010 Annual Report Download - page 144
Download and view the complete annual report
Please find page 144 of the 2010 HSBC annual report below. You can navigate through the pages in the report by either clicking on the pages listed below, or by using the keyword search tool below to find specific information within the annual report.-
 1
1 -
2
-
3
-
4
-
5
-
6
-
7
-
8
-
9
-
10
-
11
-
12
-
13
-
14
-
15
-
16
-
17
-
18
-
19
-
20
-
21
-
22
-
23
-
24
-
25
-
26
-
27
-
28
-
29
-
30
-
31
-
32
-
33
-
34
-
35
-
36
-
37
-
38
-
39
-
40
-
41
-
42
-
43
-
44
-
45
-
46
-
47
-
48
-
49
-
50
-
51
-
52
-
53
-
54
-
55
-
56
-
57
-
58
-
59
-
60
-
61
-
62
-
63
-
64
-
65
-
66
-
67
-
68
-
69
-
70
-
71
-
72
-
73
-
74
-
75
-
76
-
77
-
78
-
79
-
80
-
81
-
82
-
83
-
84
-
85
-
86
-
87
-
88
-
89
-
90
-
91
-
92
-
93
-
94
-
95
-
96
-
97
-
98
-
99
-
100
-
101
-
102
-
103
-
104
-
105
-
106
-
107
-
108
-
109
-
110
-
111
-
112
-
113
-
114
-
115
-
116
-
117
-
118
-
119
-
120
-
121
-
122
-
123
-
124
-
125
-
126
-
127
-
128
-
129
-
130
-
131
-
132
-
133
-
 134
134 -
 135
135 -
 136
136 -
 137
137 -
 138
138 -
 139
139 -
 140
140 -
 141
141 -
 142
142 -
 143
143 -
 144
144 -
 145
145 -
 146
146 -
 147
147 -
 148
148 -
 149
149 -
 150
150 -
 151
151 -
 152
152 -
 153
153 -
 154
154 -
155
-
156
-
157
-
158
-
159
-
160
-
161
-
162
-
163
-
164
-
165
-
166
-
167
-
168
-
169
-
170
-
171
-
172
-
173
-
174
-
175
-
176
-
177
-
178
-
179
-
180
-
181
-
182
-
183
-
184
-
185
-
186
-
187
-
188
-
189
-
190
-
191
-
192
-
193
-
194
-
195
-
196
-
197
-
198
-
199
-
200
-
201
-
202
-
203
-
204
-
205
-
206
-
207
-
208
-
209
-
210
-
211
-
212
-
213
-
214
-
215
-
216
-
217
-
218
-
219
-
220
-
221
-
222
-
223
-
224
-
225
-
226
-
227
-
228
-
229
-
230
-
231
-
232
-
233
-
234
-
235
-
236
-
237
-
238
-
239
-
240
-
241
-
242
-
243
-
244
-
245
-
246
-
247
-
248
-
249
-
250
-
251
-
252
-
253
-
254
-
255
-
256
-
257
-
258
-
259
-
260
-
261
-
262
-
263
-
264
-
265
-
266
-
267
-
268
-
269
-
270
-
271
-
272
-
273
-
274
-
275
-
276
-
277
-
278
-
279
-
280
-
281
-
282
-
283
-
284
-
285
-
286
-
287
-
288
-
289
-
290
-
291
-
292
-
293
-
294
-
295
-
296
-
297
-
298
-
299
-
300
-
301
-
302
-
303
-
304
-
305
-
306
-
307
-
308
-
309
-
310
-
311
-
312
-
313
-
314
-
315
-
316
-
317
-
318
-
319
-
320
-
321
-
322
-
323
-
324
-
325
-
326
-
327
-
328
-
329
-
330
-
331
-
332
-
333
-
334
-
335
-
336
-
337
-
338
-
339
-
340
-
341
-
342
-
343
-
344
-
345
-
346
-
347
-
348
-
349
-
350
-
351
-
352
-
353
-
354
-
355
-
356
-
357
-
358
-
359
-
360
-
361
-
362
-
363
-
364
-
365
-
366
-
367
-
368
-
369
-
370
-
371
-
372
-
373
-
374
-
375
-
376
-
377
-
378
-
379
-
380
-
381
-
382
-
383
-
384
-
385
-
386
-
387
-
388
-
389
-
390
-
391
-
392
-
393
-
394
-
395
-
396
 |
 |

HSBC HOLDINGS PLC
Report of the Directors: Operating and Financial Review (continued)
Risk > Liquidity and funding > The management of liquidity risk / Contingent liquidity risk
142
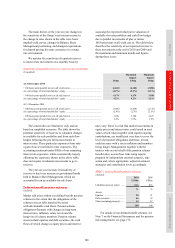
according to their contractual maturities. The
undiscounted cash flows potentially payable under
financial guarantees and similar contracts are
classified on the basis of the earliest date they can be
called.
Cash flows payable in respect of customer
accounts are primarily contractually repayable on
demand or at short notice. However, in practice, short-
term deposit balances remain stable as inflows and
outflows broadly match and a significant portion of
loan commitments expire without being drawn upon.
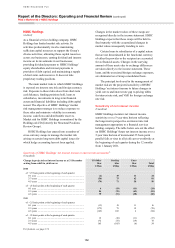
The management of liquidity risk
(Audited)
We use a number of principal measures to manage
liquidity risk, as described below.
Advances to core funding ratio
We emphasise the importance of core customer
deposits as a source of funds to finance lending to
customers, and discourage reliance on short-term
professional funding. This is achieved by placing
limits on banking entities which restrict their ability
to increase loans and advances to customers without
corresponding growth in their core customer deposits
or long-term debt funding. This measure is referred
to as the ‘advances to core funding’ ratio. Previously,
we utilised the ‘advances to deposits’ ratio.
Advances to core funding ratio limits are set
by the Risk Management Meeting and monitored by
Group Finance. The ratio expresses current loans and
advances to customers as a percentage of the total of
core customer deposits and term funding with a
remaining term to maturity in excess of one year.
Loans and advances to customers which are part of
reverse repurchase arrangements, and where we
receive securities which are deemed to be liquid, are
excluded from the advances to core funding ratio.
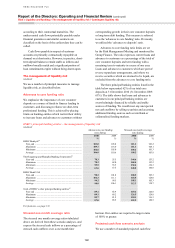
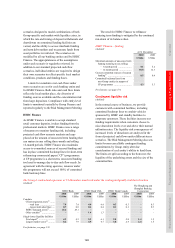
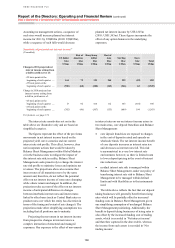
The three principal banking entities listed in the
table below represented 62% of our total core
deposits at 31 December 2010 (31 December 2009:
63%). The table shows that loans and advances to
customers in our principal banking entities are
overwhelmingly financed by reliable and stable
sources of funding. We would meet any unexpected
net cash outflows by selling securities and accessing
additional funding sources such as interbank or
collateralised lending markets.
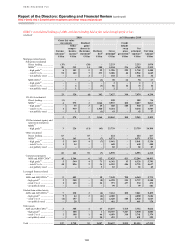
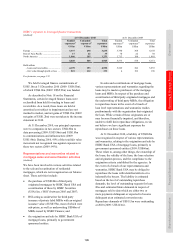
HSBC’s principal banking entities – the management of liquidity risk
(Audited)
Advances to core funding
ratio during:
Stressed one month coverage
ratio during:
2010
2009
2010
2009
%
%
%
%
HSBC Bank plc55
Year-end ................................................................................ 103.0
105.0
111.1
103.2
Maximum ............................................................................. 109.7
116.0
111.3
108.1
Minimum .............................................................................. 102.6
105.0
103.2
101.3
Average ................................................................................. 106.0
110.6
108.2
103.9
The Hongkong and Shanghai Banking Corporation55
Year-end ................................................................................ 70.3
55.5
144.6
153.2
Maximum ............................................................................. 70.3
62.0
165.4
153.2
Minimum .............................................................................. 55.5
55.5
132.6
134.3
Average ................................................................................. 63.6
57.5
148.8
144.8
HSBC Bank USA
Year-end ................................................................................ 98.3
101.0
108.5
105.3
Maximum ............................................................................. 104.3
111.1
118.5
128.0
Minimum .............................................................................. 94.2
99.5
105.3
105.3
Average ................................................................................. 98.0
106.1
112.3
118.7
Total of HSBC’s other principal banking entities56
Year-end ................................................................................ 89.1
85.9
119.6
124.8
Maximum ............................................................................. 89.1
89.2
126.5
124.8
Minimum .............................................................................. 85.7
81.2
118.1
116.3
Average ................................................................................. 87.0
85.9
122.2
120.5
For footnotes, see page 174.
Stressed one month coverage ratio
The stressed one month coverage ratios tabulated
above are derived from these scenario analyses, and
express the stressed cash inflows as a percentage of
stressed cash outflows over a one month time
horizon. Our entities are required to target a ratio
of 100% or greater.
Projected cash flow scenario analysis
We use a number of standard projected cash flow