HSBC 2010 Annual Report Download - page 143
Download and view the complete annual report
Please find page 143 of the 2010 HSBC annual report below. You can navigate through the pages in the report by either clicking on the pages listed below, or by using the keyword search tool below to find specific information within the annual report.-
 1
1 -
2
-
3
-
4
-
5
-
6
-
7
-
8
-
9
-
10
-
11
-
12
-
13
-
14
-
15
-
16
-
17
-
18
-
19
-
20
-
21
-
22
-
23
-
24
-
25
-
26
-
27
-
28
-
29
-
30
-
31
-
32
-
33
-
34
-
35
-
36
-
37
-
38
-
39
-
40
-
41
-
42
-
43
-
44
-
45
-
46
-
47
-
48
-
49
-
50
-
51
-
52
-
53
-
54
-
55
-
56
-
57
-
58
-
59
-
60
-
61
-
62
-
63
-
64
-
65
-
66
-
67
-
68
-
69
-
70
-
71
-
72
-
73
-
74
-
75
-
76
-
77
-
78
-
79
-
80
-
81
-
82
-
83
-
84
-
85
-
86
-
87
-
88
-
89
-
90
-
91
-
92
-
93
-
94
-
95
-
96
-
97
-
98
-
99
-
100
-
101
-
102
-
103
-
104
-
105
-
106
-
107
-
108
-
109
-
110
-
111
-
112
-
113
-
114
-
115
-
116
-
117
-
118
-
119
-
120
-
121
-
122
-
123
-
124
-
125
-
126
-
127
-
128
-
129
-
130
-
131
-
132
-
 133
133 -
 134
134 -
 135
135 -
 136
136 -
 137
137 -
 138
138 -
 139
139 -
 140
140 -
 141
141 -
 142
142 -
 143
143 -
 144
144 -
 145
145 -
 146
146 -
 147
147 -
 148
148 -
 149
149 -
 150
150 -
 151
151 -
 152
152 -
 153
153 -
154
-
155
-
156
-
157
-
158
-
159
-
160
-
161
-
162
-
163
-
164
-
165
-
166
-
167
-
168
-
169
-
170
-
171
-
172
-
173
-
174
-
175
-
176
-
177
-
178
-
179
-
180
-
181
-
182
-
183
-
184
-
185
-
186
-
187
-
188
-
189
-
190
-
191
-
192
-
193
-
194
-
195
-
196
-
197
-
198
-
199
-
200
-
201
-
202
-
203
-
204
-
205
-
206
-
207
-
208
-
209
-
210
-
211
-
212
-
213
-
214
-
215
-
216
-
217
-
218
-
219
-
220
-
221
-
222
-
223
-
224
-
225
-
226
-
227
-
228
-
229
-
230
-
231
-
232
-
233
-
234
-
235
-
236
-
237
-
238
-
239
-
240
-
241
-
242
-
243
-
244
-
245
-
246
-
247
-
248
-
249
-
250
-
251
-
252
-
253
-
254
-
255
-
256
-
257
-
258
-
259
-
260
-
261
-
262
-
263
-
264
-
265
-
266
-
267
-
268
-
269
-
270
-
271
-
272
-
273
-
274
-
275
-
276
-
277
-
278
-
279
-
280
-
281
-
282
-
283
-
284
-
285
-
286
-
287
-
288
-
289
-
290
-
291
-
292
-
293
-
294
-
295
-
296
-
297
-
298
-
299
-
300
-
301
-
302
-
303
-
304
-
305
-
306
-
307
-
308
-
309
-
310
-
311
-
312
-
313
-
314
-
315
-
316
-
317
-
318
-
319
-
320
-
321
-
322
-
323
-
324
-
325
-
326
-
327
-
328
-
329
-
330
-
331
-
332
-
333
-
334
-
335
-
336
-
337
-
338
-
339
-
340
-
341
-
342
-
343
-
344
-
345
-
346
-
347
-
348
-
349
-
350
-
351
-
352
-
353
-
354
-
355
-
356
-
357
-
358
-
359
-
360
-
361
-
362
-
363
-
364
-
365
-
366
-
367
-
368
-
369
-
370
-
371
-
372
-
373
-
374
-
375
-
376
-
377
-
378
-
379
-
380
-
381
-
382
-
383
-
384
-
385
-
386
-
387
-
388
-
389
-
390
-
391
-
392
-
393
-
394
-
395
-
396
 |
 |

141
Overview Operating & Financial Review Governance Financial Statements Shareholder Information
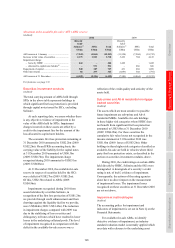
Primary sources of funding
(Audited)
Current accounts and savings deposits payable on
demand or at short notice form a significant part of
our funding, and we place considerable importance
on maintaining their stability. For deposits, stability
depends upon preserving depositor confidence in our
capital strength and liquidity, and on competitive and
transparent pricing.
We also access professional markets in order to
provide funding for non-banking subsidiaries that
do not accept deposits, to align asset and liability
maturities and currencies and to maintain a presence
in local money markets. Market disruption continued
to have adverse effects on the liquidity and funding
risk profile of the banking system in 2010. Despite
these challenges, we have continued to have good
access to debt capital markets. Group entities issued
US$26bn of term debt securities in the public capital
markets in 2010.
In aggregate, our banking entities are liquidity
providers to the interbank market, placing
significantly more funds with other banks than
they themselves borrow. Our main operating
subsidiary that does not accept deposits is HSBC
Finance, which is funded principally by taking term
funding in the professional markets and securitising
assets. At 31 December 2010, US$65bn (2009:
US$82bn) of HSBC Finance’s liabilities were drawn
from professional markets, utilising a range
of products, maturities and currencies.
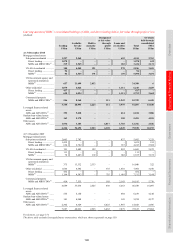
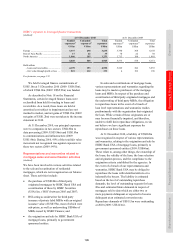
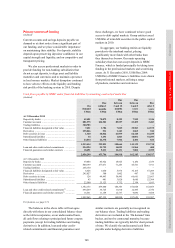
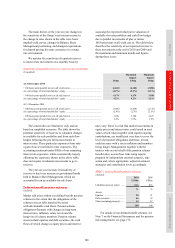
Cash flows payable by HSBC under financial liabilities by remaining contractual maturities
(Audited)
On
demand
US$m
Due
within 3
months
US$m
Due
between
3 and 12
months
US$m
Due
between
1 and 5
years
US$m
Due
after 5
years
US$m
At 31 December 2010
Deposits by banks ......................................................... 42,481 70,072 8,393 7,949 1,346
Customer accounts ........................................................ 881,575 244,501 89,557 23,209 3,483
Trading liabilities .......................................................... 300,703 – – – –
Financial liabilities designated at fair value ................. 7,421 3,786 7,825 35,583 61,575
Derivatives .................................................................... 255,046 531 1,143 2,065 942
Debt securities in issue ................................................. 1,320 48,062 41,939 62,148 16,255
Subordinated liabilities ................................................. 34 1,491 1,863 10,001 51,293
Other financial liabilities .............................................. 24,834 24,378 7,944 2,184 824
1,513,414 392,821 158,664 143,139 135,718
Loan and other credit-related commitments ................ 524,394 51,732 14,023 11,964 400
Financial guarantees and similar contracts .................. 18,491 9,233 12,231 7,082 2,399
2,056,299 453,786 184,918 162,185 138,517
At 31 December 2009
Deposits by banks ......................................................... 39,484 85,922 18,925 6,180 1,359
Customer accounts ........................................................ 800,199 277,071 71,243 45,561 7,911
Trading liabilities .......................................................... 268,130 – – – –
Financial liabilities designated at fair value ................. 6,628 1,050 5,976 36,185 67,209
Derivatives .................................................................... 245,027 300 1,002 467 320
Debt securities in issue ................................................. 124 49,493 38,445 66,661 22,663
Subordinated liabilities ................................................. 43 481 3,020 8,660 52,304
Other financial liabilities .............................................. 22,500 25,123 5,732 2,354 1,103
1,382,135 439,440 144,343 166,068 152,869
Loan and other credit-related commitments54 .............. 494,269 36,726 11,810 12,495 2,750
Financial guarantees and similar contracts54 ................ 16,561 11,169 12,737 9,096 3,688
1,892,965 487,335 168,890 187,659 159,307
For footnote, see page 174.
The balances in the above table will not agree
directly with those in our consolidated balance sheet
as the table incorporates, on an undiscounted basis,
all cash flows relating to principal and future coupon
payments (except for trading liabilities and trading
derivatives). In addition, loan and other credit-
related commitments and financial guarantees and
similar contracts are generally not recognised on
our balance sheet. Trading liabilities and trading
derivatives are included in the ‘On demand’ time
bucket, and not by contractual maturity, because
trading liabilities are typically held for short periods
of time. We classify the undiscounted cash flows
payable under hedging derivative liabilities