HSBC 2010 Annual Report Download - page 336
Download and view the complete annual report
Please find page 336 of the 2010 HSBC annual report below. You can navigate through the pages in the report by either clicking on the pages listed below, or by using the keyword search tool below to find specific information within the annual report.-
 1
1 -
2
-
3
-
4
-
5
-
6
-
7
-
8
-
9
-
10
-
11
-
12
-
13
-
14
-
15
-
16
-
17
-
18
-
19
-
20
-
21
-
22
-
23
-
24
-
25
-
26
-
27
-
28
-
29
-
30
-
31
-
32
-
33
-
34
-
35
-
36
-
37
-
38
-
39
-
40
-
41
-
42
-
43
-
44
-
45
-
46
-
47
-
48
-
49
-
50
-
51
-
52
-
53
-
54
-
55
-
56
-
57
-
58
-
59
-
60
-
61
-
62
-
63
-
64
-
65
-
66
-
67
-
68
-
69
-
70
-
71
-
72
-
73
-
74
-
75
-
76
-
77
-
78
-
79
-
80
-
81
-
82
-
83
-
84
-
85
-
86
-
87
-
88
-
89
-
90
-
91
-
92
-
93
-
94
-
95
-
96
-
97
-
98
-
99
-
100
-
101
-
102
-
103
-
104
-
105
-
106
-
107
-
108
-
109
-
110
-
111
-
112
-
113
-
114
-
115
-
116
-
117
-
118
-
119
-
120
-
121
-
122
-
123
-
124
-
125
-
126
-
127
-
128
-
129
-
130
-
131
-
132
-
133
-
134
-
135
-
136
-
137
-
138
-
139
-
140
-
141
-
142
-
143
-
144
-
145
-
146
-
147
-
148
-
149
-
150
-
151
-
152
-
153
-
154
-
155
-
156
-
157
-
158
-
159
-
160
-
161
-
162
-
163
-
164
-
165
-
166
-
167
-
168
-
169
-
170
-
171
-
172
-
173
-
174
-
175
-
176
-
177
-
178
-
179
-
180
-
181
-
182
-
183
-
184
-
185
-
186
-
187
-
188
-
189
-
190
-
191
-
192
-
193
-
194
-
195
-
196
-
197
-
198
-
199
-
200
-
201
-
202
-
203
-
204
-
205
-
206
-
207
-
208
-
209
-
210
-
211
-
212
-
213
-
214
-
215
-
216
-
217
-
218
-
219
-
220
-
221
-
222
-
223
-
224
-
225
-
226
-
227
-
228
-
229
-
230
-
231
-
232
-
233
-
234
-
235
-
236
-
237
-
238
-
239
-
240
-
241
-
242
-
243
-
244
-
245
-
246
-
247
-
248
-
249
-
250
-
251
-
252
-
253
-
254
-
255
-
256
-
257
-
258
-
259
-
260
-
261
-
262
-
263
-
264
-
265
-
266
-
267
-
268
-
269
-
270
-
271
-
272
-
273
-
274
-
275
-
276
-
277
-
278
-
279
-
280
-
281
-
282
-
283
-
284
-
285
-
286
-
287
-
288
-
289
-
290
-
291
-
292
-
293
-
294
-
295
-
296
-
297
-
298
-
299
-
300
-
301
-
302
-
303
-
304
-
305
-
306
-
307
-
308
-
309
-
310
-
311
-
312
-
313
-
314
-
315
-
316
-
317
-
318
-
319
-
320
-
321
-
322
-
323
-
324
-
325
-
 326
326 -
 327
327 -
 328
328 -
 329
329 -
 330
330 -
 331
331 -
 332
332 -
 333
333 -
 334
334 -
 335
335 -
 336
336 -
 337
337 -
 338
338 -
 339
339 -
 340
340 -
 341
341 -
 342
342 -
 343
343 -
 344
344 -
 345
345 -
 346
346 -
347
-
348
-
349
-
350
-
351
-
352
-
353
-
354
-
355
-
356
-
357
-
358
-
359
-
360
-
361
-
362
-
363
-
364
-
365
-
366
-
367
-
368
-
369
-
370
-
371
-
372
-
373
-
374
-
375
-
376
-
377
-
378
-
379
-
380
-
381
-
382
-
383
-
384
-
385
-
386
-
387
-
388
-
389
-
390
-
391
-
392
-
393
-
394
-
395
-
396
 |
 |

HSBC HOLDINGS PLC
Notes on the Financial Statements (continued)
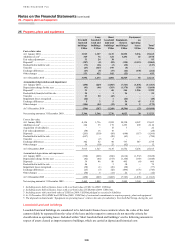
24 – Goodwill and intangible assets
334
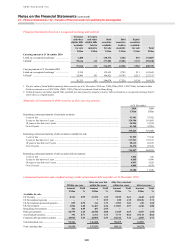
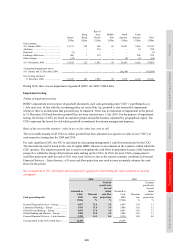
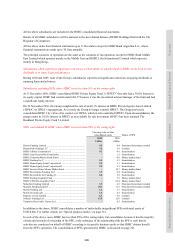
At 1 July 2010, aggregate goodwill of US$4,674m (1 July 2009: US$4,475m) had been allocated to CGUs that were
not considered individually significant. These CGUs do not carry on their balance sheets any significant intangible
assets with indefinite useful lives, other than goodwill.
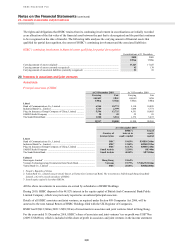
Nominal long-term growth rate: external data that reflects the market’s assessment of GDP and inflation for the
countries within which the CGU operates. The rates used for 2009 and 2010 are taken as an average of the last
10 years.
Discount rate: the discount rate used to discount the cash flows is based on the cost of capital assigned to each CGU,
which is derived using a Capital Asset Pricing Model (‘CAPM’). The CAPM depends on inputs reflecting a number
of financial and economic variables including the risk-free rate in the country concerned and a premium to reflect the
inherent risk of the business being evaluated. These variables are based on the market’s assessment of the economic
variables and management’s judgement. In addition, for the purposes of testing goodwill for impairment,
management supplements this process by comparing the discount rates derived using the internally generated CAPM
with cost of capital rates produced by external sources. HSBC uses externally-sourced cost of capital rates where, in
management’s judgement, those rates reflect more accurately the current market and economic conditions. For 2010
and 2009, internal costs of capital rates were consistent with externally-sourced rates.
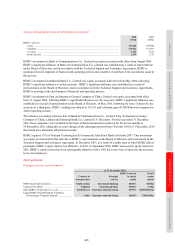
Management’s judgement in estimating the cash flows of a CGU: the cash flow projections for each CGU are
based on plans approved by the Group Management Board. The key assumptions in addition to the discount rate and
nominal long-term growth rate for each significant CGU are discussed below.
Personal Financial Services – Europe and Commercial Banking – Europe: the assumptions included in the cash flow
projections for Personal Financial Services – Europe and Commercial Banking – Europe reflect the economic
environment and financial outlook of the European countries within these two segments. Key assumptions include the
level of interest rates and the level and change in unemployment rates. While current economic conditions in Europe
continue to be challenging, management’s cash flow projections are based primarily on these prevailing conditions.
Risks include a double-dip recession in the UK and the continuation of base rates at their current low levels. Based on
the conditions at the balance sheet date, management determined that a reasonably possible change in any of the key
assumptions described above would not cause an impairment to be recognised in respect of Personal Financial
Services – Europe or Commercial Banking – Europe.
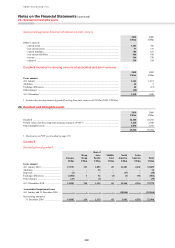
Global Private Banking – Europe: the revenues in Global Private Banking – Europe are predominately generated
through HSBC’s client relationships. The cash flow forecast reflects current economic conditions and key
assumptions include the level of interest rates and client risk appetite. Further economic deterioration could result in a
decrease in assets under management and a reduction in fee and trading income through increased client risk
aversion. Based on the conditions at the balance sheet date, management determined that a reasonably possible
change in any of the key assumptions described above would not cause an impairment to be recognised in respect of
Global Private Banking – Europe.
Global Banking and Markets – Europe: the cash flows generated by Global Banking and Markets – Europe are
diversified and there is no one key assumption that drives the cash flow projection of this CGU. In line with other
CGUs, Global Banking and Markets – Europe is sensitive to changes in the interest rate environment and the strength
of economic recovery in Europe. One of the key factors which may impact the carrying value of this CGU is the level
of impairment charges which may emerge in the future, particularly in respect of holdings of available-for-sale sub-
prime and Alt-A Residential MBSs. Based on management’s current assessment of the credit quality of these
securities, which includes stressed scenarios for collateral defaults and house prices, and the level of credit support
available, management determined that a reasonably possible change in key assumptions would not cause an
impairment to be recognised in respect of Global Banking and Markets – Europe.
Personal Financial Services – Latin America: the assumptions included in the cash flow projections for Personal
Financial Services – Latin America reflect the economic environment and financial outlook of the countries within
this segment, with Brazil and Mexico being two of the largest countries included within this segment. Key
assumptions include the growth in lending and deposit volumes and the credit quality of the loan portfolios. Mexico
and Central America in particular are sensitive to economic conditions in the US which could constrain demand.
Based on the conditions at the balance sheet date, management determined that a reasonably possible change in any
of the key assumptions described above would not cause an impairment to be recognised in respect of Personal
Financial Services – Latin America.