HSBC 2010 Annual Report Download - page 135
Download and view the complete annual report
Please find page 135 of the 2010 HSBC annual report below. You can navigate through the pages in the report by either clicking on the pages listed below, or by using the keyword search tool below to find specific information within the annual report.-
 1
1 -
2
-
3
-
4
-
5
-
6
-
7
-
8
-
9
-
10
-
11
-
12
-
13
-
14
-
15
-
16
-
17
-
18
-
19
-
20
-
21
-
22
-
23
-
24
-
25
-
26
-
27
-
28
-
29
-
30
-
31
-
32
-
33
-
34
-
35
-
36
-
37
-
38
-
39
-
40
-
41
-
42
-
43
-
44
-
45
-
46
-
47
-
48
-
49
-
50
-
51
-
52
-
53
-
54
-
55
-
56
-
57
-
58
-
59
-
60
-
61
-
62
-
63
-
64
-
65
-
66
-
67
-
68
-
69
-
70
-
71
-
72
-
73
-
74
-
75
-
76
-
77
-
78
-
79
-
80
-
81
-
82
-
83
-
84
-
85
-
86
-
87
-
88
-
89
-
90
-
91
-
92
-
93
-
94
-
95
-
96
-
97
-
98
-
99
-
100
-
101
-
102
-
103
-
104
-
105
-
106
-
107
-
108
-
109
-
110
-
111
-
112
-
113
-
114
-
115
-
116
-
117
-
118
-
119
-
120
-
121
-
122
-
123
-
124
-
 125
125 -
 126
126 -
 127
127 -
 128
128 -
 129
129 -
 130
130 -
 131
131 -
 132
132 -
 133
133 -
 134
134 -
 135
135 -
 136
136 -
 137
137 -
 138
138 -
 139
139 -
 140
140 -
 141
141 -
 142
142 -
 143
143 -
 144
144 -
 145
145 -
146
-
147
-
148
-
149
-
150
-
151
-
152
-
153
-
154
-
155
-
156
-
157
-
158
-
159
-
160
-
161
-
162
-
163
-
164
-
165
-
166
-
167
-
168
-
169
-
170
-
171
-
172
-
173
-
174
-
175
-
176
-
177
-
178
-
179
-
180
-
181
-
182
-
183
-
184
-
185
-
186
-
187
-
188
-
189
-
190
-
191
-
192
-
193
-
194
-
195
-
196
-
197
-
198
-
199
-
200
-
201
-
202
-
203
-
204
-
205
-
206
-
207
-
208
-
209
-
210
-
211
-
212
-
213
-
214
-
215
-
216
-
217
-
218
-
219
-
220
-
221
-
222
-
223
-
224
-
225
-
226
-
227
-
228
-
229
-
230
-
231
-
232
-
233
-
234
-
235
-
236
-
237
-
238
-
239
-
240
-
241
-
242
-
243
-
244
-
245
-
246
-
247
-
248
-
249
-
250
-
251
-
252
-
253
-
254
-
255
-
256
-
257
-
258
-
259
-
260
-
261
-
262
-
263
-
264
-
265
-
266
-
267
-
268
-
269
-
270
-
271
-
272
-
273
-
274
-
275
-
276
-
277
-
278
-
279
-
280
-
281
-
282
-
283
-
284
-
285
-
286
-
287
-
288
-
289
-
290
-
291
-
292
-
293
-
294
-
295
-
296
-
297
-
298
-
299
-
300
-
301
-
302
-
303
-
304
-
305
-
306
-
307
-
308
-
309
-
310
-
311
-
312
-
313
-
314
-
315
-
316
-
317
-
318
-
319
-
320
-
321
-
322
-
323
-
324
-
325
-
326
-
327
-
328
-
329
-
330
-
331
-
332
-
333
-
334
-
335
-
336
-
337
-
338
-
339
-
340
-
341
-
342
-
343
-
344
-
345
-
346
-
347
-
348
-
349
-
350
-
351
-
352
-
353
-
354
-
355
-
356
-
357
-
358
-
359
-
360
-
361
-
362
-
363
-
364
-
365
-
366
-
367
-
368
-
369
-
370
-
371
-
372
-
373
-
374
-
375
-
376
-
377
-
378
-
379
-
380
-
381
-
382
-
383
-
384
-
385
-
386
-
387
-
388
-
389
-
390
-
391
-
392
-
393
-
394
-
395
-
396
 |
 |

133
Overview Operating & Financial Review Governance Financial Statements Shareholder Information
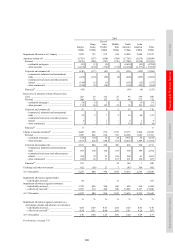
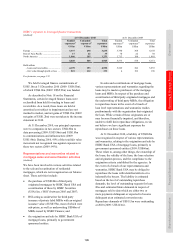
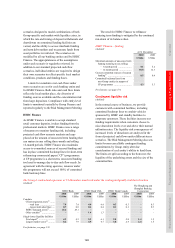
Carrying amount of HSBC’s consolidated holdings of ABSs, and direct lending held at fair value through profit or loss
(Audited)
Trading
Available
for sale
Held to
maturity
Designated
at fair value
through
profit
Loans and
receivables Total
Of which
held through
consolidated
SPEs
US$m US$m US$m US$m US$m US$m US$m
At 31 December 2010
Mortgage-related assets
Sub-prime residential ............ 1,297 2,565 – – 652 4,514 2,763
Direct lending .................... 1,078 ––– – 1,078 632
MBSs and MBS CDOs41 ... 219 2,565 –– 652 3,436 2,131
US Alt-A residential .............. 180 4,545 191 – 270 5,186 3,651
Direct lending .................... 96 ––– – 96 –
MBSs41 .............................. 84 4,545 191 – 270 5,090 3,651
US Government agency and
sponsored enterprises
MBSs41 .............................. 657 21,699 2,032 – – 24,388 6
Other residential .................... 1,075 4,024 – – 1,111 6,210 2,669
Direct lending .................... 417 ––– – 417 –
MBSs41 .............................. 658 4,024 –– 1,111 5,793 2,669
Commercial property
MBSs and MBS CDOs41 ... 546 8,160 – 111 1,942 10,759 6,441
3,755 40,993 2,223 111 3,975 51,057 15,530
Leveraged finance-related
assets
ABSs and ABS CDOs41 ........ 392 5,418 – – 414 6,224 3,886
Student loan-related assets
ABSs and ABS CDOs41 ........ 163 5,178 – – 150 5,491 4,251
Other assets
ABSs and ABS CDOs41 ........ 1,936 3,103 – 6,017 1,710 12,766 2,526
6,246 54,692 2,223 6,128 6,249 75,538 26,193
At 31 December 2009
Mortgage-related assets
Sub-prime residential ............ 2,063 2,782 – – 837 5,682 3,213
Direct lending .................... 1,439 – – – – 1,439 913
MBSs and MBS CDOs41 ... 624 2,782 – – 837 4,243 2,300
US Alt-A residential .............. 191 5,403 192 – 882 6,668 3,672
Direct lending .................... 113 – – – – 113 –
MBSs41 .............................. 78 5,403 192 – 882 6,555 3,672
US Government agency and
sponsored enterprises
MBSs41 .............................. 375 13,332 2,333 – – 16,040 322
Other residential .................... 1,646 4,582 – 335 1,401 7,964 3,160
Direct lending .................... 452 – – – – 452 –
MBSs41 .............................. 1,194 4,582 – 335 1,401 7,512 3,160
Commercial property
MBSs and MBS CDOs41 ... 414 7,535 – 103 2,143 10,195 5,730
4,689 33,634 2,525 438 5,263 46,549 16,097
Leveraged finance-related
assets
ABSs and ABS CDOs41 ........ 555 5,150 – – 484 6,189 4,144
Student loan-related assets
ABSs and ABS CDOs41 ........ 141 4,948 – – 145 5,234 4,127
Other assets
ABSs and ABS CDOs41 ........ 2,302 4,329 – 6,025 1,987 14,643 2,696
7,687 48,061 2,525 6,463 7,879 72,615 27,064
For footnote, see page 174.
The above table excludes leveraged finance transactions, which are shown separately on page 139.