ADT 2011 Annual Report Download - page 98
Download and view the complete annual report
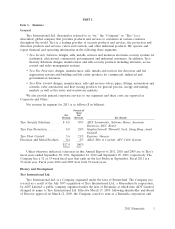
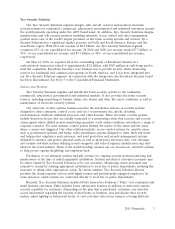
Please find page 98 of the 2011 ADT annual report below. You can navigate through the pages in the report by either clicking on the pages listed below, or by using the keyword search tool below to find specific information within the annual report.-
 1
1 -
2
-
3
-
4
-
5
-
6
-
7
-
8
-
9
-
10
-
11
-
12
-
13
-
14
-
15
-
16
-
17
-
18
-
19
-
20
-
21
-
22
-
23
-
24
-
25
-
26
-
27
-
28
-
29
-
30
-
31
-
32
-
33
-
34
-
35
-
36
-
37
-
38
-
39
-
40
-
41
-
42
-
43
-
44
-
45
-
46
-
47
-
48
-
49
-
50
-
51
-
52
-
53
-
54
-
55
-
56
-
57
-
58
-
59
-
60
-
61
-
62
-
63
-
64
-
65
-
66
-
67
-
68
-
69
-
70
-
71
-
72
-
73
-
74
-
75
-
76
-
77
-
78
-
79
-
80
-
81
-
82
-
83
-
84
-
85
-
86
-
87
-
 88
88 -
 89
89 -
 90
90 -
 91
91 -
 92
92 -
 93
93 -
 94
94 -
 95
95 -
 96
96 -
 97
97 -
 98
98 -
 99
99 -
 100
100 -
 101
101 -
 102
102 -
 103
103 -
 104
104 -
 105
105 -
 106
106 -
 107
107 -
 108
108 -
109
-
110
-
111
-
112
-
113
-
114
-
115
-
116
-
117
-
118
-
119
-
120
-
121
-
122
-
123
-
124
-
125
-
126
-
127
-
128
-
129
-
130
-
131
-
132
-
133
-
134
-
135
-
136
-
137
-
138
-
139
-
140
-
141
-
142
-
143
-
144
-
145
-
146
-
147
-
148
-
149
-
150
-
151
-
152
-
153
-
154
-
155
-
156
-
157
-
158
-
159
-
160
-
161
-
162
-
163
-
164
-
165
-
166
-
167
-
168
-
169
-
170
-
171
-
172
-
173
-
174
-
175
-
176
-
177
-
178
-
179
-
180
-
181
-
182
-
183
-
184
-
185
-
186
-
187
-
188
-
189
-
190
-
191
-
192
-
193
-
194
-
195
-
196
-
197
-
198
-
199
-
200
-
201
-
202
-
203
-
204
-
205
-
206
-
207
-
208
-
209
-
210
-
211
-
212
-
213
-
214
-
215
-
216
-
217
-
218
-
219
-
220
-
221
-
222
-
223
-
224
-
225
-
226
-
227
-
228
-
229
-
230
-
231
-
232
-
233
-
234
-
235
-
236
-
237
-
238
-
239
-
240
-
241
-
242
-
243
-
244
-
245
-
246
-
247
-
248
-
249
-
250
-
251
-
252
-
253
-
254
-
255
-
256
-
257
-
258
-
259
-
260
-
261
-
262
-
263
-
264
-
265
-
266
-
267
-
268
-
269
-
270
-
271
-
272
-
273
-
274
-
275
-
276
-
277
-
278
-
279
-
280
-
281
-
282
-
283
-
284
-
285
-
286
-
287
-
288
-
289
-
290
-
291
-
292
-
293
-
294
-
295
-
296
-
297
-
298
-
299
-
300
-
301
-
302
-
303
-
304
-
305
-
306
-
307
-
308
-
309
-
310
-
311
-
312
-
313
 |
 |

A-2 2012 Proxy Statement
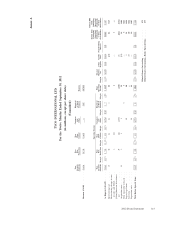
Annex A
TYCO INTERNATIONAL LTD.
ORGANIC GROWTH RECONCILIATION—REVENUE
(in millions)
(Unaudited)
Twelve Months Ended September 30, 2011
Net Revenue for the Adjusted Net Revenue for the
Base Year Adjustments
Twelve Months Ended 2010 Base Twelve Months Ended
September 24, 2010 Acquisitions (Divestitures) Revenue Foreign Currency Acquisitions Other(2) Organic Revenue(1) September 30, 2011(3)
Tyco Security Solutions ....... $7,734 $355 4.6% $ (148) -1.9% $ 7,941 $192 2.5% $28 0.4% $ 38 0.5% $427 5.4% $ 8,626 11.5%
Tyco Fire Protection ......... 4,510 — 0.0% (49) -1.1% 4,461 126 2.8% 7 0.2% (12) -0.3% 161 3.6% 4,743 5.2%
Tyco Flow Control .......... 3,373 — 0.0% (15) -0.4% 3,358 183 5.4% 22 0.7% 45 1.3% 31 0.9% 3,639 7.9%
Total before Electrical and Metal
Products .............. $15,617 $355 2.3% $ (212) -1.4% $15,760 $501 3.2% $57 0.4% $71 0.5% $619 3.9% $17,008 8.9%
Electrical and Metal Products . . . 1,399 — 0.0% (1,102) -78.8% 297 2 0.1% 4 0.3% — 0.0% 44 14.8% 347 -75.2%
Total Net Revenue .......... $17,016 $355 2.1% $(1,314) -7.7% $16,057 $503 3.0% $61 0.4% $71 0.4% $663 4.1% $17,355 2.0%
(1) Organic revenue growth percentage based on adjusted 2010 base revenue.
(2) Amounts represent the impact of the 53rd week of revenue for each segment during fiscal 2011 and the deconsolidation of a joint venture in the Tyco Fire Protection Segment.
(3) For purposes of the Annual Incentive Plan, additional adjustments are made to derive revenue for Tyco and each business segment on a constant currency basis. These adjustments generally
relate to the calculation of revenue to foreign exchange rates in effect at the beginning of the period. Other adjustments may be approved by the Compensation Committee based on factors it
deems appropriate. For fiscal 2011, these adjustments were (i) a decrease in overall Tyco revenue of $348 million, all of which related to f/x rate calculations, (ii) a $108 million decrease for
Tyco Security Solutions, which primarily related to f/x rates and a reallocation of revenue from certain Tyco Fire Protection businesses and (iii) a decrease of $126 million for Tyco Fire
Protection, primarily related to f/x rates and a reallocation of revenue to Tyco Security Solutions for certain businesses.