ADT 2011 Annual Report Download - page 138
Download and view the complete annual report
Please find page 138 of the 2011 ADT annual report below. You can navigate through the pages in the report by either clicking on the pages listed below, or by using the keyword search tool below to find specific information within the annual report.-
 1
1 -
2
-
3
-
4
-
5
-
6
-
7
-
8
-
9
-
10
-
11
-
12
-
13
-
14
-
15
-
16
-
17
-
18
-
19
-
20
-
21
-
22
-
23
-
24
-
25
-
26
-
27
-
28
-
29
-
30
-
31
-
32
-
33
-
34
-
35
-
36
-
37
-
38
-
39
-
40
-
41
-
42
-
43
-
44
-
45
-
46
-
47
-
48
-
49
-
50
-
51
-
52
-
53
-
54
-
55
-
56
-
57
-
58
-
59
-
60
-
61
-
62
-
63
-
64
-
65
-
66
-
67
-
68
-
69
-
70
-
71
-
72
-
73
-
74
-
75
-
76
-
77
-
78
-
79
-
80
-
81
-
82
-
83
-
84
-
85
-
86
-
87
-
88
-
89
-
90
-
91
-
92
-
93
-
94
-
95
-
96
-
97
-
98
-
99
-
100
-
101
-
102
-
103
-
104
-
105
-
106
-
107
-
108
-
109
-
110
-
111
-
112
-
113
-
114
-
115
-
116
-
117
-
118
-
119
-
120
-
121
-
122
-
123
-
124
-
125
-
126
-
127
-
 128
128 -
 129
129 -
 130
130 -
 131
131 -
 132
132 -
 133
133 -
 134
134 -
 135
135 -
 136
136 -
 137
137 -
 138
138 -
 139
139 -
 140
140 -
 141
141 -
 142
142 -
 143
143 -
 144
144 -
 145
145 -
 146
146 -
 147
147 -
 148
148 -
149
-
150
-
151
-
152
-
153
-
154
-
155
-
156
-
157
-
158
-
159
-
160
-
161
-
162
-
163
-
164
-
165
-
166
-
167
-
168
-
169
-
170
-
171
-
172
-
173
-
174
-
175
-
176
-
177
-
178
-
179
-
180
-
181
-
182
-
183
-
184
-
185
-
186
-
187
-
188
-
189
-
190
-
191
-
192
-
193
-
194
-
195
-
196
-
197
-
198
-
199
-
200
-
201
-
202
-
203
-
204
-
205
-
206
-
207
-
208
-
209
-
210
-
211
-
212
-
213
-
214
-
215
-
216
-
217
-
218
-
219
-
220
-
221
-
222
-
223
-
224
-
225
-
226
-
227
-
228
-
229
-
230
-
231
-
232
-
233
-
234
-
235
-
236
-
237
-
238
-
239
-
240
-
241
-
242
-
243
-
244
-
245
-
246
-
247
-
248
-
249
-
250
-
251
-
252
-
253
-
254
-
255
-
256
-
257
-
258
-
259
-
260
-
261
-
262
-
263
-
264
-
265
-
266
-
267
-
268
-
269
-
270
-
271
-
272
-
273
-
274
-
275
-
276
-
277
-
278
-
279
-
280
-
281
-
282
-
283
-
284
-
285
-
286
-
287
-
288
-
289
-
290
-
291
-
292
-
293
-
294
-
295
-
296
-
297
-
298
-
299
-
300
-
301
-
302
-
303
-
304
-
305
-
306
-
307
-
308
-
309
-
310
-
311
-
312
-
313
 |
 |

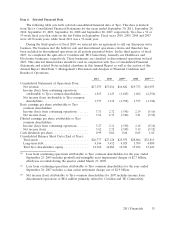
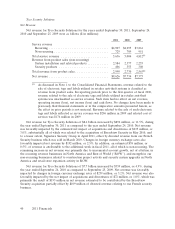
Item 6. Selected Financial Data
The following table sets forth selected consolidated financial data of Tyco. This data is derived
from Tyco’s Consolidated Financial Statements for the years ended September 30, 2011, September 24,
2010, September 25, 2009, September 26, 2008 and September 28, 2007, respectively. Tyco has a 52 or
53-week fiscal year that ends on the last Friday in September. Fiscal years 2010, 2009, 2008 and 2007
were all 52-week years, while fiscal 2011 was a 53-week year.
During the third quarter of fiscal 2010, we entered into an agreement to sell our European water
business. The business met the held for sale and discontinued operations criteria and therefore has
been included in discontinued operations in all periods presented below. In the third quarter of fiscal
2007, we completed the spin-offs of Covidien and TE Connectivity, formerly our Healthcare and
Electronics businesses, respectively. These businesses are classified as discontinued operations in fiscal
2007. This selected financial data should be read in conjunction with Tyco’s Consolidated Financial
Statements and related Notes included elsewhere in this Annual Report as well as the section of this
Annual Report titled Item 7. Management’s Discussion and Analysis of Financial Condition and
Results of Operations.
2011 2010 2009(1) 2008 2007(2)(3)
Consolidated Statements of Operations Data:
Net revenue ........................... $17,355 $17,016 $16,882 $19,733 $18,055
Income (loss) from continuing operations
attributable to Tyco common shareholders .... 1,565 1,125 (1,845) 1,062 (2,556)
Net income (loss) attributable to Tyco common
shareholders .......................... 1,733 1,132 (1,798) 1,553 (1,742)
Basic earnings per share attributable to Tyco
common shareholders:
Income (loss) from continuing operations ...... 3.31 2.32 (3.90) 2.19 (5.16)
Net income (loss) ....................... 3.66 2.33 (3.80) 3.21 (3.52)
Diluted earnings per share attributable to Tyco
common shareholders:
Income (loss) from continuing operations ...... 3.27 2.31 (3.90) 2.18 (5.16)
Net income (loss) ....................... 3.62 2.32 (3.80) 3.19 (3.52)
Cash dividends per share .................... 0.99 0.86 0.84 0.65 1.60
Consolidated Balance Sheet Data (End of Year):
Total assets ............................ $26,777 $27,128 $25,553 $28,804 $32,815
Long-term debt ......................... 4,146 3,652 4,029 3,709 4,080
Total Tyco shareholders’ equity .............. 14,182 14,084 12,941 15,494 15,624
(1) Loss from continuing operations attributable to Tyco common shareholders for the year ended
September 25, 2009 includes goodwill and intangible asset impairment charges of $2.7 billion,
which was recorded during the quarter ended March 27, 2009.
(2) Loss from continuing operations attributable to Tyco common shareholders for the year ended
September 28, 2007 includes a class action settlement charge, net of $2.9 billion.
(3) Net income (loss) attributable to Tyco common shareholders for 2007 includes income from
discontinued operations of $814 million primarily related to Covidien and TE Connectivity.
2011 Financials 35