ADT 2011 Annual Report Download - page 301
Download and view the complete annual report
Please find page 301 of the 2011 ADT annual report below. You can navigate through the pages in the report by either clicking on the pages listed below, or by using the keyword search tool below to find specific information within the annual report.-
 1
1 -
2
-
3
-
4
-
5
-
6
-
7
-
8
-
9
-
10
-
11
-
12
-
13
-
14
-
15
-
16
-
17
-
18
-
19
-
20
-
21
-
22
-
23
-
24
-
25
-
26
-
27
-
28
-
29
-
30
-
31
-
32
-
33
-
34
-
35
-
36
-
37
-
38
-
39
-
40
-
41
-
42
-
43
-
44
-
45
-
46
-
47
-
48
-
49
-
50
-
51
-
52
-
53
-
54
-
55
-
56
-
57
-
58
-
59
-
60
-
61
-
62
-
63
-
64
-
65
-
66
-
67
-
68
-
69
-
70
-
71
-
72
-
73
-
74
-
75
-
76
-
77
-
78
-
79
-
80
-
81
-
82
-
83
-
84
-
85
-
86
-
87
-
88
-
89
-
90
-
91
-
92
-
93
-
94
-
95
-
96
-
97
-
98
-
99
-
100
-
101
-
102
-
103
-
104
-
105
-
106
-
107
-
108
-
109
-
110
-
111
-
112
-
113
-
114
-
115
-
116
-
117
-
118
-
119
-
120
-
121
-
122
-
123
-
124
-
125
-
126
-
127
-
128
-
129
-
130
-
131
-
132
-
133
-
134
-
135
-
136
-
137
-
138
-
139
-
140
-
141
-
142
-
143
-
144
-
145
-
146
-
147
-
148
-
149
-
150
-
151
-
152
-
153
-
154
-
155
-
156
-
157
-
158
-
159
-
160
-
161
-
162
-
163
-
164
-
165
-
166
-
167
-
168
-
169
-
170
-
171
-
172
-
173
-
174
-
175
-
176
-
177
-
178
-
179
-
180
-
181
-
182
-
183
-
184
-
185
-
186
-
187
-
188
-
189
-
190
-
191
-
192
-
193
-
194
-
195
-
196
-
197
-
198
-
199
-
200
-
201
-
202
-
203
-
204
-
205
-
206
-
207
-
208
-
209
-
210
-
211
-
212
-
213
-
214
-
215
-
216
-
217
-
218
-
219
-
220
-
221
-
222
-
223
-
224
-
225
-
226
-
227
-
228
-
229
-
230
-
231
-
232
-
233
-
234
-
235
-
236
-
237
-
238
-
239
-
240
-
241
-
242
-
243
-
244
-
245
-
246
-
247
-
248
-
249
-
250
-
251
-
252
-
253
-
254
-
255
-
256
-
257
-
258
-
259
-
260
-
261
-
262
-
263
-
264
-
265
-
266
-
267
-
268
-
269
-
270
-
271
-
272
-
273
-
274
-
275
-
276
-
277
-
278
-
279
-
280
-
281
-
282
-
283
-
284
-
285
-
286
-
287
-
288
-
289
-
290
-
 291
291 -
 292
292 -
 293
293 -
 294
294 -
 295
295 -
 296
296 -
 297
297 -
 298
298 -
 299
299 -
 300
300 -
 301
301 -
 302
302 -
 303
303 -
 304
304 -
 305
305 -
 306
306 -
 307
307 -
 308
308 -
 309
309 -
 310
310 -
 311
311 -
312
-
313
 |
 |

TYCO INTERNATIONAL LTD.
NOTES TO THE FINANCIAL STATEMENTS FOR THE FISCAL YEAR ENDED SEPTEMBER 30, 2011
(Continued)
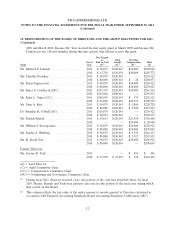
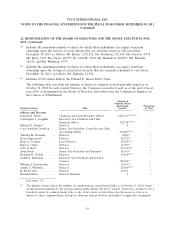
12. REMUNERATION OF THE BOARD OF DIRECTORS AND THE GROUP EXECUTIVES FOR 2011
(Continued)
Summary Compensation Table
Change in
Pension
Value and
Nonqualified
Non-Equity Deferred
Stock/Unit Option Incentive Compensation All Other
Salary Bonus(1) Awards(2) Awards(2) Plan Earnings(4) Compensation(5) Total
Name and Principal Position Year ($) ($) ($) ($) Compensation(3) ($) ($) ($)
(a) (b) (c) (d) (e) (f) ($)(g) (h) (i) (j)
Current Officers
Edward D. Breen ................. 2011 1,625,000 — 4,913,163 4,797,849 2,925,000 3,880,000 2,238,610 20,379,622
Chairman and Chief Executive Officer 2010 1,625,000 — 4,419,090 4,515,932 4,062,500 3,842,000 1,404,351 19,868,873
Frank S. Sklarsky ................. 2011 583,333 500,000 3,163,322 874,517 1,008,000 — 140,502 6,269,674
Executive Vice President and Chief Financial 2010 — — — — — — — —
Officer
Judith A. Reinsdorf ................ 2011 532,500 — 1,102,852 686,570 616,500 — 186,980 3,125,402
Executive Vice President and General Counsel 2010 525,000 — 921,578 796,339 840,000 — 185,452 3,268,369
Carol Anthony Davidson ............. 2011 452,500 — 646,515 403,805 491,500 — 171,875 2,166,195
Senior Vice President, Controller and Chief 2010 445,000 — 672,503 584,450 667,500 — 162,287 2,531,740
Accounting Officer
Arun Nayar .................... 2011 425,000 — 646,515 403,805 464,500 — 150,322 2,090,142
Senior Vice President and Treasurer 2010 410,000 — 672,503 584,450 615,000 — 179,367 2,461,320
Former Officers
Christopher J. Coughlin .............. 2011 800,000 — — — 720,000 — 260,804 1,780,804
Executive Vice President and Chief Financial 2010 800,000 — 3,416,580 4,497,948 1,600,000 — 307,226 10,621,754
Officer
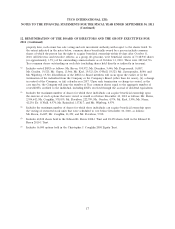
(1) Bonus: The amount reported in column (d) for Mr. Sklarsky reflects the bonus received upon joining the Company in December 2010.
(2) Stock/Unit Awards and Option Awards: The amounts in columns (e) and (f) reflect the fair value of equity awards granted in fiscal 2011 and fiscal
2010, which consisted of stock options, restricted stock units (RSUs) and performance share units. The amounts reported in columns (e) and (f) for
the Company’s executive board represents the fair value of the entire amount of the award calculated in accordance with Financial Accounting
Standards Board ASC Topic 718, excluding the effect of estimated forfeitures. For stock options, amounts are computed by multiplying the fair value
of the award (as determined under the Black-Scholes option pricing model) by the total number of options granted. For RSUs, fair value is
computed by multiplying the total number of shares subject to the award by the closing market price of Tyco common stock on the date of grant. For
performance share units, fair value is based on a model that considers the closing market price of Tyco common stock on the date of grant, the range
of shares subject to such stock award, and the estimated probabilities of vesting outcomes. The value of performance share units included in the table
assumes target performance. The following amounts represent the maximum potential performance share value by individual: Mr. Breen—$9,826,325;
Mr. Sklarsky—$1,792,294; Mr. Coughlin—$0; Ms. Reinsdorf—$1,527,026; Mr. Davidson—$897,757; Mr. Nayar—$897,757. Amounts in columns (f) for
Mr. Coughlin include the incremental fair value of certain modifications made to outstanding options in connection with the fiscal 2010 equity grant.
These prior grants, which total 435,728 stock options, were made as part of the fiscal 2006, 2007 and 2009 annual equity incentive program. The
awards were modified to provide that if Mr. Coughlin remains employed by the Company on October 8, 2011, then the options will remain
exercisable throughout the entire ten-year period commencing on their grant dates, rather than the three-year window that normally follows
retirement, and that any unvested options outstanding on such date (which would consist of 1⁄4 of the stock options granted in connection with the
fiscal 2009 incentive program) would immediately vest.
(3) Non-Equity Incentive Plan Compensation: The amounts reported in column (g) for each named executive officer reflect annual cash incentive
compensation for fiscal 2011 and 2010 (which was based on Company and individual performance in fiscal 2011 and 2010, and paid in the first
quarter of fiscal 2012 and 2011, respectively).
(4) Change in Pension Value and Non-Qualified Deferred Compensation Earnings: The amounts reported in column (h) for Mr. Breen reflect the
aggregate increase in the actuarial present value of his accumulated benefits under all pension plans during fiscal 2011 and 2010, determined using
interest rate and mortality rate assumptions consistent with those used in the Company’s consolidated financial statements.
(5) All Other Compensation: The amounts reported in column (i) for each named executive officer represent cash perquisites, insurance premiums paid
by the Company for the benefit of the officer (and, in some cases, the officer’s spouse), costs related to personal use of Company aircraft, tax gross-
up payments, Company contributions to 401(k) plans and non-qualified plans of the Company and its subsidiaries providing similar benefits, and
other miscellaneous benefits.
14