ADT 2011 Annual Report Download - page 145
Download and view the complete annual report
Please find page 145 of the 2011 ADT annual report below. You can navigate through the pages in the report by either clicking on the pages listed below, or by using the keyword search tool below to find specific information within the annual report.-
 1
1 -
2
-
3
-
4
-
5
-
6
-
7
-
8
-
9
-
10
-
11
-
12
-
13
-
14
-
15
-
16
-
17
-
18
-
19
-
20
-
21
-
22
-
23
-
24
-
25
-
26
-
27
-
28
-
29
-
30
-
31
-
32
-
33
-
34
-
35
-
36
-
37
-
38
-
39
-
40
-
41
-
42
-
43
-
44
-
45
-
46
-
47
-
48
-
49
-
50
-
51
-
52
-
53
-
54
-
55
-
56
-
57
-
58
-
59
-
60
-
61
-
62
-
63
-
64
-
65
-
66
-
67
-
68
-
69
-
70
-
71
-
72
-
73
-
74
-
75
-
76
-
77
-
78
-
79
-
80
-
81
-
82
-
83
-
84
-
85
-
86
-
87
-
88
-
89
-
90
-
91
-
92
-
93
-
94
-
95
-
96
-
97
-
98
-
99
-
100
-
101
-
102
-
103
-
104
-
105
-
106
-
107
-
108
-
109
-
110
-
111
-
112
-
113
-
114
-
115
-
116
-
117
-
118
-
119
-
120
-
121
-
122
-
123
-
124
-
125
-
126
-
127
-
128
-
129
-
130
-
131
-
132
-
133
-
134
-
 135
135 -
 136
136 -
 137
137 -
 138
138 -
 139
139 -
 140
140 -
 141
141 -
 142
142 -
 143
143 -
 144
144 -
 145
145 -
 146
146 -
 147
147 -
 148
148 -
 149
149 -
 150
150 -
 151
151 -
 152
152 -
 153
153 -
 154
154 -
 155
155 -
156
-
157
-
158
-
159
-
160
-
161
-
162
-
163
-
164
-
165
-
166
-
167
-
168
-
169
-
170
-
171
-
172
-
173
-
174
-
175
-
176
-
177
-
178
-
179
-
180
-
181
-
182
-
183
-
184
-
185
-
186
-
187
-
188
-
189
-
190
-
191
-
192
-
193
-
194
-
195
-
196
-
197
-
198
-
199
-
200
-
201
-
202
-
203
-
204
-
205
-
206
-
207
-
208
-
209
-
210
-
211
-
212
-
213
-
214
-
215
-
216
-
217
-
218
-
219
-
220
-
221
-
222
-
223
-
224
-
225
-
226
-
227
-
228
-
229
-
230
-
231
-
232
-
233
-
234
-
235
-
236
-
237
-
238
-
239
-
240
-
241
-
242
-
243
-
244
-
245
-
246
-
247
-
248
-
249
-
250
-
251
-
252
-
253
-
254
-
255
-
256
-
257
-
258
-
259
-
260
-
261
-
262
-
263
-
264
-
265
-
266
-
267
-
268
-
269
-
270
-
271
-
272
-
273
-
274
-
275
-
276
-
277
-
278
-
279
-
280
-
281
-
282
-
283
-
284
-
285
-
286
-
287
-
288
-
289
-
290
-
291
-
292
-
293
-
294
-
295
-
296
-
297
-
298
-
299
-
300
-
301
-
302
-
303
-
304
-
305
-
306
-
307
-
308
-
309
-
310
-
311
-
312
-
313
 |
 |

Non-recurring revenue declined by $75 million, or 2.1%, to approximately $3.4 billion during the
year ended September 24, 2010, as compared to the year ended September 25, 2009, due to lower sales
volume primarily as the result of weakness in the commercial end market, which declined at a slower
rate than the same period in the prior year. Changes in foreign currency exchange rates favorably
impacted systems installation, product sales and other service revenue by $122 million, or 3.5%, while
the net impact of acquisitions and divestitures resulted in an unfavorable impact of $76 million, or
2.2%.
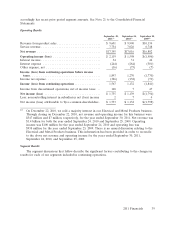
Revenue by Geography
North American revenue consists of residential and small business, primarily a recurring revenue
business, and commercial, primarily a non-recurring revenue business. Europe, Middle East and Africa
(‘‘EMEA’’) and ROW revenue are primarily commercial. Net revenue by geography for Tyco Security
Solutions was as follows ($in millions):
2011 2010 2009
North America ................................ $5,102 $4,436 $4,185
Europe, Middle East and Africa ................... 1,726 1,738 1,875
Rest of World ................................ 1,392 1,207 1,007
Tyco Security Products(1) ......................... 406 353 308
Net revenue .................................. $8,626 $7,734 $7,375
(1) Tyco Security Products is managed as a global business.
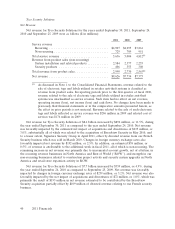
North America
Net revenue in North America increased by $666 million, or 15.0%, for the year ended
September 30, 2011 as compared to the year ended September 24, 2010, primarily as a result of the
acquisition of Broadview Security. Changes in foreign currency exchange rates favorably impacted
North American revenue by $25 million, or 0.6%. Residential and small business net revenue increased
by 19.9% compared to the year ended September 24, 2010, primarily due to the acquisition of
Broadview Security. Commercial net revenue increased by 8.2%, as compared to the year ended
September 24, 2010, primarily as a result of an increase in construction projects and security system
upgrades in the commercial end markets which was partially offset by softness in the retail market.
Net revenue in North America increased by $251 million, or 6.0%, for the year ended
September 24, 2010 as compared to the year ended September 25, 2009, primarily as the result of the
net impact of acquisitions and divestitures, which favorably impacted net revenue by an estimated
$193 million, or 4.6%, as the result of the acquisition of Broadview Security. Changes in foreign
currency exchange rates also favorably impacted net revenue by $48 million, or 1.1%. Residential and
small business net revenue increased by 15.3% compared to the year ended September 25, 2010,
primarily due to the acquisition of Broadview Security. Commercial net revenue decreased by 4.8% due
to the decline in systems installation and product sales as the result of weakness in the commercial
market, although the rate of decline was slower than the same period in the prior year.
Europe, Middle East, and Africa
Net revenue in EMEA decreased by $12 million, or 0.7%, for the year ended September 30, 2011
as compared to the year ended September 24, 2010, primarily due to the unfavorable net impact of
acquisitions and divestitures of $138 million, or 7.9%, resulting from the sale of certain businesses,
including the French security business in March 2010, and several smaller businesses in Europe over
the course of fiscal 2010. The decrease was partially offset by favorable changes in foreign currency
42 2011 Financials