ADT 2011 Annual Report Download - page 61
Download and view the complete annual report
Please find page 61 of the 2011 ADT annual report below. You can navigate through the pages in the report by either clicking on the pages listed below, or by using the keyword search tool below to find specific information within the annual report.-
 1
1 -
2
-
3
-
4
-
5
-
6
-
7
-
8
-
9
-
10
-
11
-
12
-
13
-
14
-
15
-
16
-
17
-
18
-
19
-
20
-
21
-
22
-
23
-
24
-
25
-
26
-
27
-
28
-
29
-
30
-
31
-
32
-
33
-
34
-
35
-
36
-
37
-
38
-
39
-
40
-
41
-
42
-
43
-
44
-
45
-
46
-
47
-
48
-
49
-
50
-
 51
51 -
 52
52 -
 53
53 -
 54
54 -
 55
55 -
 56
56 -
 57
57 -
 58
58 -
 59
59 -
 60
60 -
 61
61 -
 62
62 -
 63
63 -
 64
64 -
 65
65 -
 66
66 -
 67
67 -
 68
68 -
 69
69 -
 70
70 -
 71
71 -
72
-
73
-
74
-
75
-
76
-
77
-
78
-
79
-
80
-
81
-
82
-
83
-
84
-
85
-
86
-
87
-
88
-
89
-
90
-
91
-
92
-
93
-
94
-
95
-
96
-
97
-
98
-
99
-
100
-
101
-
102
-
103
-
104
-
105
-
106
-
107
-
108
-
109
-
110
-
111
-
112
-
113
-
114
-
115
-
116
-
117
-
118
-
119
-
120
-
121
-
122
-
123
-
124
-
125
-
126
-
127
-
128
-
129
-
130
-
131
-
132
-
133
-
134
-
135
-
136
-
137
-
138
-
139
-
140
-
141
-
142
-
143
-
144
-
145
-
146
-
147
-
148
-
149
-
150
-
151
-
152
-
153
-
154
-
155
-
156
-
157
-
158
-
159
-
160
-
161
-
162
-
163
-
164
-
165
-
166
-
167
-
168
-
169
-
170
-
171
-
172
-
173
-
174
-
175
-
176
-
177
-
178
-
179
-
180
-
181
-
182
-
183
-
184
-
185
-
186
-
187
-
188
-
189
-
190
-
191
-
192
-
193
-
194
-
195
-
196
-
197
-
198
-
199
-
200
-
201
-
202
-
203
-
204
-
205
-
206
-
207
-
208
-
209
-
210
-
211
-
212
-
213
-
214
-
215
-
216
-
217
-
218
-
219
-
220
-
221
-
222
-
223
-
224
-
225
-
226
-
227
-
228
-
229
-
230
-
231
-
232
-
233
-
234
-
235
-
236
-
237
-
238
-
239
-
240
-
241
-
242
-
243
-
244
-
245
-
246
-
247
-
248
-
249
-
250
-
251
-
252
-
253
-
254
-
255
-
256
-
257
-
258
-
259
-
260
-
261
-
262
-
263
-
264
-
265
-
266
-
267
-
268
-
269
-
270
-
271
-
272
-
273
-
274
-
275
-
276
-
277
-
278
-
279
-
280
-
281
-
282
-
283
-
284
-
285
-
286
-
287
-
288
-
289
-
290
-
291
-
292
-
293
-
294
-
295
-
296
-
297
-
298
-
299
-
300
-
301
-
302
-
303
-
304
-
305
-
306
-
307
-
308
-
309
-
310
-
311
-
312
-
313
 |
 |
13DEC201119172497
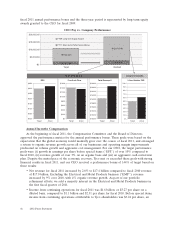
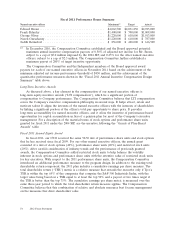
increase of over 20% from the $2.68 achieved in fiscal 2010. Due in part to productivity
initiatives taken by the Company in past years, the operating margin before special items
improved 160 basis points year-over-year, excluding the benefit from the contribution of the
EMP business in the first quarter.
• The Company continued to generate solid free cash flow. Free cash flow was $1.1 billion in fiscal
2011, compared to $1.4 billion in 2010, and included $252 million of cash payments related to
special items. Free cash flow was reduced in 2011 due in part to an increased use of cash to
fund working capital resulting from increased business activity, although working capital days
were in line with fiscal 2010. The Company used its excess cash to make growth oriented
investments and acquisitions. The Company also returned approximately $1.8 billion to
shareholders through share repurchases and dividends, and completed the year with $1.4 billion
in cash and cash equivalents.
• In September 2011, we announced our intention to separate into three independent publicly-
traded companies. Over the last four years, we have worked to strengthen the Company’s
competitive position in its core security, fire protection and flow control businesses by driving
organic growth, investing in research and development and technology, increasing efficiency and
productivity and making strategic acquisitions. As a result, each business is now in a position to
operate independently with a strong financial position, exceptional brands, highly skilled
employees and talented, experienced leadership.
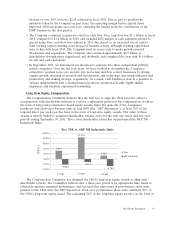
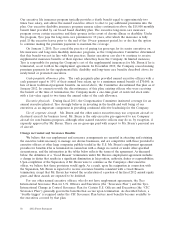
Long Term Equity Compensation
The Compensation Committee believes that the best way to align the chief executive officer’s
compensation with shareholder interests is to place a substantial portion of his compensation at-risk in
the form of long-term performance based equity awards. Since the spin-offs of the Company’s
healthcare and electronics business units in July 2007 (the ‘‘2007 Separation’’), at least 70% of his
targeted direct pay each year has been in the form of long-term equity awards. The value of these
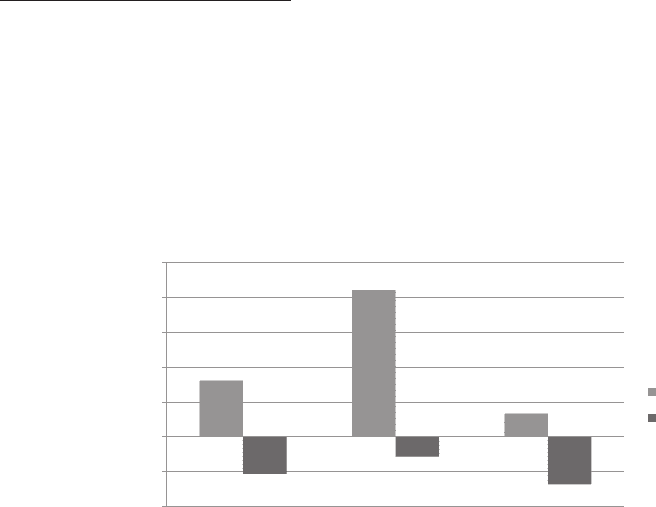
awards is directly linked to sustained shareholder returns, and over the past one, three and five year
periods ending September 30, 2011, Tyco’s total shareholder return has outperformed the S&P 500
Industrials Index:
Tyco TSR vs. S&P 500 Industrials Index
8.06%
21.03%
3.33%
-5.28%
-2.82%
-6.78%
-10.00%
-5.00%
0.00%
5.00%
10.00%
15.00%
20.00%
25.00%
Tyco
S&P Industrials
1 Year 3 Year 5 Year
TSR (%)
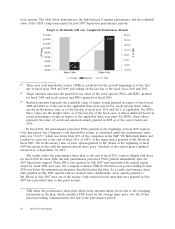
The Compensation Committee has designed the CEO’s long-term equity awards to align with
shareholder returns. The Committee believes that a three-year period is an appropriate time frame to
effectively measure sustained performance, and has used this time-frame in performance share units
granted to the CEO since the 2007 Separation. Each year, performance share units constitute 50% of
the CEO’s long-term equity award. The remaining 50% of the long-term equity award is in the form of
2012 Proxy Statement 47