ADT 2011 Annual Report Download - page 146
Download and view the complete annual report
Please find page 146 of the 2011 ADT annual report below. You can navigate through the pages in the report by either clicking on the pages listed below, or by using the keyword search tool below to find specific information within the annual report.-
 1
1 -
2
-
3
-
4
-
5
-
6
-
7
-
8
-
9
-
10
-
11
-
12
-
13
-
14
-
15
-
16
-
17
-
18
-
19
-
20
-
21
-
22
-
23
-
24
-
25
-
26
-
27
-
28
-
29
-
30
-
31
-
32
-
33
-
34
-
35
-
36
-
37
-
38
-
39
-
40
-
41
-
42
-
43
-
44
-
45
-
46
-
47
-
48
-
49
-
50
-
51
-
52
-
53
-
54
-
55
-
56
-
57
-
58
-
59
-
60
-
61
-
62
-
63
-
64
-
65
-
66
-
67
-
68
-
69
-
70
-
71
-
72
-
73
-
74
-
75
-
76
-
77
-
78
-
79
-
80
-
81
-
82
-
83
-
84
-
85
-
86
-
87
-
88
-
89
-
90
-
91
-
92
-
93
-
94
-
95
-
96
-
97
-
98
-
99
-
100
-
101
-
102
-
103
-
104
-
105
-
106
-
107
-
108
-
109
-
110
-
111
-
112
-
113
-
114
-
115
-
116
-
117
-
118
-
119
-
120
-
121
-
122
-
123
-
124
-
125
-
126
-
127
-
128
-
129
-
130
-
131
-
132
-
133
-
134
-
135
-
 136
136 -
 137
137 -
 138
138 -
 139
139 -
 140
140 -
 141
141 -
 142
142 -
 143
143 -
 144
144 -
 145
145 -
 146
146 -
 147
147 -
 148
148 -
 149
149 -
 150
150 -
 151
151 -
 152
152 -
 153
153 -
 154
154 -
 155
155 -
 156
156 -
157
-
158
-
159
-
160
-
161
-
162
-
163
-
164
-
165
-
166
-
167
-
168
-
169
-
170
-
171
-
172
-
173
-
174
-
175
-
176
-
177
-
178
-
179
-
180
-
181
-
182
-
183
-
184
-
185
-
186
-
187
-
188
-
189
-
190
-
191
-
192
-
193
-
194
-
195
-
196
-
197
-
198
-
199
-
200
-
201
-
202
-
203
-
204
-
205
-
206
-
207
-
208
-
209
-
210
-
211
-
212
-
213
-
214
-
215
-
216
-
217
-
218
-
219
-
220
-
221
-
222
-
223
-
224
-
225
-
226
-
227
-
228
-
229
-
230
-
231
-
232
-
233
-
234
-
235
-
236
-
237
-
238
-
239
-
240
-
241
-
242
-
243
-
244
-
245
-
246
-
247
-
248
-
249
-
250
-
251
-
252
-
253
-
254
-
255
-
256
-
257
-
258
-
259
-
260
-
261
-
262
-
263
-
264
-
265
-
266
-
267
-
268
-
269
-
270
-
271
-
272
-
273
-
274
-
275
-
276
-
277
-
278
-
279
-
280
-
281
-
282
-
283
-
284
-
285
-
286
-
287
-
288
-
289
-
290
-
291
-
292
-
293
-
294
-
295
-
296
-
297
-
298
-
299
-
300
-
301
-
302
-
303
-
304
-
305
-
306
-
307
-
308
-
309
-
310
-
311
-
312
-
313
 |
 |

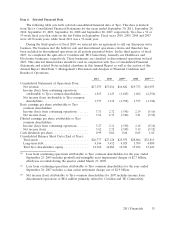
exchange rates of $70 million, or 4.0%. Stronger systems installation across Continental Europe also
favorably increased net revenue.
Net revenue in EMEA decreased by $137 million, or 7.3%, for the year ended September 24, 2010
as compared to the year ended September 25, 2009, as favorable changes in foreign currency exchange
rates of $60 million, or 3.2%, were more than offset by a decline in systems installation and other
service revenue as a result of weakness in the commercial end market, although the rate of decline was
slower than the same period in the prior year. Additionally, EMEA net revenue was unfavorably
impacted by $120 million, or 6.4%, due to the impact of divestitures.
Rest of World
Net revenue in ROW increased by $185 million, or 15.3%, for the year ended September 30, 2011
as compared to the year ended September 24, 2010. Changes in foreign currency exchange rates
favorably impacted net revenue by $83 million, or 6.9%. The remaining increase in net revenue in
ROW was primarily attributable to retail store expansion, increases in the customer account bases and
increased systems installation activity in the Asia Pacific and Latin America regions.
Net revenue in ROW increased by $200 million, or 19.9%, for the year ended September 24, 2010
as compared to the year ended September 25, 2009, primarily due to recurring revenue growth in both
Latin American and Asia Pacific regions resulting from customer account growth. The Asia-Pacific
region experienced an increase in system installation, products sales and other service revenue which
was partially offset by a decrease in the Latin American region due to a slowdown in commercial and
retailer end markets. Net revenue in the Rest of World geographies was also favorably impacted by
changes in foreign currency exchange rates of $111 million, or 11.0%.
Tyco Security Products
Net revenue in Tyco Security Products increased by $53 million, or 15.0%, for the year ended
September 30, 2011 as compared to the year ended September 24, 2010. Changes in foreign currency
exchange rates favorably impacted net revenue by $14 million, or 4.0%. The remaining increase in net
revenue was primarily due to growth across multiple product lines globally.
Net revenue in Tyco Security Products increased by $45 million, or 14.6%, for the year ended
September 24, 2010 as compared to the year ended September 25, 2009. Changes in foreign currency
exchange rates favorably impacted net revenue by $20 million, or 6.5%. Additionally, net revenue
increased due to higher volume primarily related to the introduction of several new products.
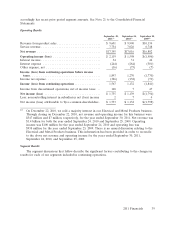
Operating Income and Operating Margin
Operating income and operating margin for Tyco Security Solutions were as follows ($ in millions):
2011 2010 2009
Operating income ............................. $1,361 $1,090 $(514)
Operating margin ............................. 15.8% 14.1% —%(1)
(1) Certain operating margins and percentages have not been presented as management
believes such calculations are not meaningful.
2011 Financials 43