ADT 2011 Annual Report Download - page 140
Download and view the complete annual report
Please find page 140 of the 2011 ADT annual report below. You can navigate through the pages in the report by either clicking on the pages listed below, or by using the keyword search tool below to find specific information within the annual report.-
 1
1 -
2
-
3
-
4
-
5
-
6
-
7
-
8
-
9
-
10
-
11
-
12
-
13
-
14
-
15
-
16
-
17
-
18
-
19
-
20
-
21
-
22
-
23
-
24
-
25
-
26
-
27
-
28
-
29
-
30
-
31
-
32
-
33
-
34
-
35
-
36
-
37
-
38
-
39
-
40
-
41
-
42
-
43
-
44
-
45
-
46
-
47
-
48
-
49
-
50
-
51
-
52
-
53
-
54
-
55
-
56
-
57
-
58
-
59
-
60
-
61
-
62
-
63
-
64
-
65
-
66
-
67
-
68
-
69
-
70
-
71
-
72
-
73
-
74
-
75
-
76
-
77
-
78
-
79
-
80
-
81
-
82
-
83
-
84
-
85
-
86
-
87
-
88
-
89
-
90
-
91
-
92
-
93
-
94
-
95
-
96
-
97
-
98
-
99
-
100
-
101
-
102
-
103
-
104
-
105
-
106
-
107
-
108
-
109
-
110
-
111
-
112
-
113
-
114
-
115
-
116
-
117
-
118
-
119
-
120
-
121
-
122
-
123
-
124
-
125
-
126
-
127
-
128
-
129
-
 130
130 -
 131
131 -
 132
132 -
 133
133 -
 134
134 -
 135
135 -
 136
136 -
 137
137 -
 138
138 -
 139
139 -
 140
140 -
 141
141 -
 142
142 -
 143
143 -
 144
144 -
 145
145 -
 146
146 -
 147
147 -
 148
148 -
 149
149 -
 150
150 -
151
-
152
-
153
-
154
-
155
-
156
-
157
-
158
-
159
-
160
-
161
-
162
-
163
-
164
-
165
-
166
-
167
-
168
-
169
-
170
-
171
-
172
-
173
-
174
-
175
-
176
-
177
-
178
-
179
-
180
-
181
-
182
-
183
-
184
-
185
-
186
-
187
-
188
-
189
-
190
-
191
-
192
-
193
-
194
-
195
-
196
-
197
-
198
-
199
-
200
-
201
-
202
-
203
-
204
-
205
-
206
-
207
-
208
-
209
-
210
-
211
-
212
-
213
-
214
-
215
-
216
-
217
-
218
-
219
-
220
-
221
-
222
-
223
-
224
-
225
-
226
-
227
-
228
-
229
-
230
-
231
-
232
-
233
-
234
-
235
-
236
-
237
-
238
-
239
-
240
-
241
-
242
-
243
-
244
-
245
-
246
-
247
-
248
-
249
-
250
-
251
-
252
-
253
-
254
-
255
-
256
-
257
-
258
-
259
-
260
-
261
-
262
-
263
-
264
-
265
-
266
-
267
-
268
-
269
-
270
-
271
-
272
-
273
-
274
-
275
-
276
-
277
-
278
-
279
-
280
-
281
-
282
-
283
-
284
-
285
-
286
-
287
-
288
-
289
-
290
-
291
-
292
-
293
-
294
-
295
-
296
-
297
-
298
-
299
-
300
-
301
-
302
-
303
-
304
-
305
-
306
-
307
-
308
-
309
-
310
-
311
-
312
-
313
 |
 |
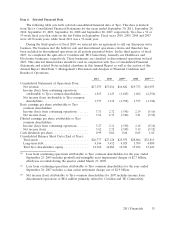
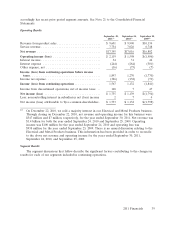
ended September 30, 2011. Net revenue increased across all of our segments mainly attributable to
strength in our Tyco Security Solutions and Tyco Fire Protection segments and to a lesser extent our
Tyco Flow Control segment. Favorable changes in foreign currency exchange rates also impacted net
revenue by $503 million, or 3.0%. In addition, because the Company’s fiscal year ends on the last
Friday in September, fiscal 2011 consisted of 53 weeks, as compared to 52 weeks in fiscal 2010 and
2009. As a result, fiscal year 2011 includes an estimated $143 million, or 0.8%, of revenue from the
additional week.
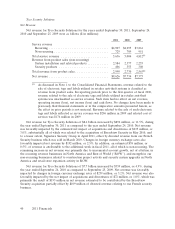
Service revenue, which is primarily recurring in nature, represented approximately 45% of our
overall revenue for the year ended September 30, 2011 as compared to 41% and 40% for 2010 and
2009, respectively. Service revenue as a percentage of net revenue increased due to the divestiture of
our Electrical and Metal Products business, which did not have a significant service component as well
as due to strength in our Tyco Security Solutions and Tyco Fire Protection businesses. Service revenues
are principally derived from our Tyco Security Solutions and Tyco Fire Protection businesses, and
represent a consistent source of revenue from monitoring and maintenance services under contractual
agreements. Recurring revenue in our Tyco Security Solutions business grew to approximately 57% of
Tyco Security Solutions’ total revenue for the year ended September 30, 2011 which is primarily due to
the integration of Broadview Security, compared to approximately 56% for the year ended
September 24, 2010, and 52% for the year ended September 25, 2009. In the Tyco Fire Protection
business, service revenue remained steady as a percentage of Tyco Fire Protection’s total revenue at
38% in 2011 and 2010, as compared to 36% in 2009. For the year ended September 30, 2011,
non-service revenue in Tyco Security Solutions and Tyco Fire Protection improved slightly compared to
the prior annual periods, due to strength in systems installation and related products and product sales
in Tyco Security Solutions and product sales in Tyco Fire Protection. These improvements were partially
offset by continued weakness in our Tyco Flow Control segment’s Water and Environmental Systems
business.
Operating income for the year ended September 30, 2011 increased $521 million, or 33%, to
$2.1 billion, as compared to operating income of $1.6 billion for the year ended September 24, 2010.
Operating income for the year ended September 30, 2011 includes a net gain on divestitures of $230
million primarily related to the sale of a majority interest in our Electrical and Metal products business
compared to a net gain on divestitures of $40 million for the year ended September 24, 2010.
Operating income was also favorably impacted by changes in foreign currency exchange rates of
$60 million, or 3.8%. The increase in operating income in 2011 also reflects strong growth in our Tyco
Security Solutions business. Operating income was favorably impacted for the year ended
September 30, 2011 due to lower restructuring and asset impairment charges of $87 million as
compared to $145 million for the year ended September 24, 2010. Operating income for the year ended
September 30, 2011 included acquisition and integration costs of $39 million as compared to
$35 million for the year ended September 24, 2010.
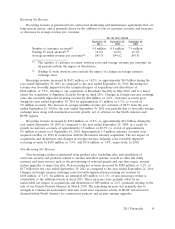
Our cash balance was $1.4 billion and $1.8 billion as of September 30, 2011 and September 24,
2010, respectively. We generated approximately $2.4 billion of cash from operating activities and
utilized $1.3 billion of cash in investing activities and $1.5 billion of cash in financing activities during
the year ended September 30, 2011. During the year ended September 30, 2011, approximately
$1.0 billion of cash was generated from divestitures, primarily related to $713 million for the sale of the
majority interest in our Electrical and Metal Products business and $264 million for the sale of our
European water business, which was presented in net cash provided by (used in) discontinued investing
activities in our Consolidated Statement of Cash Flows. During the year ended September 30, 2011,
uses of cash primarily included $1.3 billion to repurchase our common shares, $788 million of capital
expenditures, $656 million for acquisitions, net of cash acquired, $614 million to purchase customer
contracts in our Tyco Security Solutions segment and $458 million to pay cash dividends.
2011 Financials 37