ADT 2011 Annual Report Download - page 5
Download and view the complete annual report
Please find page 5 of the 2011 ADT annual report below. You can navigate through the pages in the report by either clicking on the pages listed below, or by using the keyword search tool below to find specific information within the annual report.-
 1
1 -
 2
2 -
 3
3 -
 4
4 -
 5
5 -
 6
6 -
 7
7 -
 8
8 -
 9
9 -
 10
10 -
 11
11 -
 12
12 -
 13
13 -
 14
14 -
 15
15 -
 16
16 -
17
-
18
-
19
-
20
-
21
-
22
-
23
-
24
-
25
-
26
-
27
-
28
-
29
-
30
-
31
-
32
-
33
-
34
-
35
-
36
-
37
-
38
-
39
-
40
-
41
-
42
-
43
-
44
-
45
-
46
-
47
-
48
-
49
-
50
-
51
-
52
-
53
-
54
-
55
-
56
-
57
-
58
-
59
-
60
-
61
-
62
-
63
-
64
-
65
-
66
-
67
-
68
-
69
-
70
-
71
-
72
-
73
-
74
-
75
-
76
-
77
-
78
-
79
-
80
-
81
-
82
-
83
-
84
-
85
-
86
-
87
-
88
-
89
-
90
-
91
-
92
-
93
-
94
-
95
-
96
-
97
-
98
-
99
-
100
-
101
-
102
-
103
-
104
-
105
-
106
-
107
-
108
-
109
-
110
-
111
-
112
-
113
-
114
-
115
-
116
-
117
-
118
-
119
-
120
-
121
-
122
-
123
-
124
-
125
-
126
-
127
-
128
-
129
-
130
-
131
-
132
-
133
-
134
-
135
-
136
-
137
-
138
-
139
-
140
-
141
-
142
-
143
-
144
-
145
-
146
-
147
-
148
-
149
-
150
-
151
-
152
-
153
-
154
-
155
-
156
-
157
-
158
-
159
-
160
-
161
-
162
-
163
-
164
-
165
-
166
-
167
-
168
-
169
-
170
-
171
-
172
-
173
-
174
-
175
-
176
-
177
-
178
-
179
-
180
-
181
-
182
-
183
-
184
-
185
-
186
-
187
-
188
-
189
-
190
-
191
-
192
-
193
-
194
-
195
-
196
-
197
-
198
-
199
-
200
-
201
-
202
-
203
-
204
-
205
-
206
-
207
-
208
-
209
-
210
-
211
-
212
-
213
-
214
-
215
-
216
-
217
-
218
-
219
-
220
-
221
-
222
-
223
-
224
-
225
-
226
-
227
-
228
-
229
-
230
-
231
-
232
-
233
-
234
-
235
-
236
-
237
-
238
-
239
-
240
-
241
-
242
-
243
-
244
-
245
-
246
-
247
-
248
-
249
-
250
-
251
-
252
-
253
-
254
-
255
-
256
-
257
-
258
-
259
-
260
-
261
-
262
-
263
-
264
-
265
-
266
-
267
-
268
-
269
-
270
-
271
-
272
-
273
-
274
-
275
-
276
-
277
-
278
-
279
-
280
-
281
-
282
-
283
-
284
-
285
-
286
-
287
-
288
-
289
-
290
-
291
-
292
-
293
-
294
-
295
-
296
-
297
-
298
-
299
-
300
-
301
-
302
-
303
-
304
-
305
-
306
-
307
-
308
-
309
-
310
-
311
-
312
-
313
 |
 |

3 3
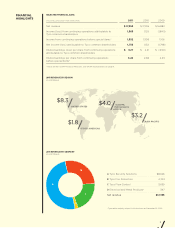
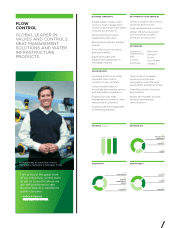
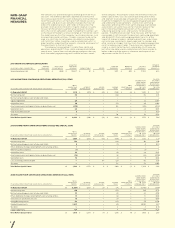
FINANCIAL
HIGHLIGHTS
2011 REVENUE BY REGION
(In US$ Billions)
$8.3
UNITED STATES
$1.8
OTHER AMERICAS
$3.2
ASIA PACIFIC
$4.0 EUROPE,
MIDDLE EAST,
AFRICA
SELECTED FINANCIAL DATA
(IN US$ MILLIONS EXCEPT PER SHARE DATA) 2011 2010 2009
Net revenue $ 17,355 $ 17,016 $ 16,882
Income (loss) from continuing operations attributable to 1,565 1,125 (1,845)
Tyco common shareholders
Income from continuing operations before special items* 1,552 1,308 1,106
Net income (loss) attributable to Tyco common shareholders 1,733 1,132 (1,798)
Diluted earnings (loss) per share from continuing operations $ 3.27 $ 2.31 $ (3.90)
attributable to Tyco common shareholders
Diluted earnings per share from continuing operations 3.24 2.68 2.33
before special items*
* These are Non-GAAP Financial Measures. See GAAP reconciliations on page 8.
2011 REVENUE BY SEGMENT
(In US$ Millions)
A Tyco Security Solutions $8,626
B Tyco Fire Protection 4,743
C Tyco Flow Control 3,639
D Electrical and Metal Products* 347
Net revenue $17,355
* Tyco sold a majority interest in this business on December 22, 2010.
A
B
C
D