ADT 2011 Annual Report Download - page 255
Download and view the complete annual report
Please find page 255 of the 2011 ADT annual report below. You can navigate through the pages in the report by either clicking on the pages listed below, or by using the keyword search tool below to find specific information within the annual report.-
 1
1 -
2
-
3
-
4
-
5
-
6
-
7
-
8
-
9
-
10
-
11
-
12
-
13
-
14
-
15
-
16
-
17
-
18
-
19
-
20
-
21
-
22
-
23
-
24
-
25
-
26
-
27
-
28
-
29
-
30
-
31
-
32
-
33
-
34
-
35
-
36
-
37
-
38
-
39
-
40
-
41
-
42
-
43
-
44
-
45
-
46
-
47
-
48
-
49
-
50
-
51
-
52
-
53
-
54
-
55
-
56
-
57
-
58
-
59
-
60
-
61
-
62
-
63
-
64
-
65
-
66
-
67
-
68
-
69
-
70
-
71
-
72
-
73
-
74
-
75
-
76
-
77
-
78
-
79
-
80
-
81
-
82
-
83
-
84
-
85
-
86
-
87
-
88
-
89
-
90
-
91
-
92
-
93
-
94
-
95
-
96
-
97
-
98
-
99
-
100
-
101
-
102
-
103
-
104
-
105
-
106
-
107
-
108
-
109
-
110
-
111
-
112
-
113
-
114
-
115
-
116
-
117
-
118
-
119
-
120
-
121
-
122
-
123
-
124
-
125
-
126
-
127
-
128
-
129
-
130
-
131
-
132
-
133
-
134
-
135
-
136
-
137
-
138
-
139
-
140
-
141
-
142
-
143
-
144
-
145
-
146
-
147
-
148
-
149
-
150
-
151
-
152
-
153
-
154
-
155
-
156
-
157
-
158
-
159
-
160
-
161
-
162
-
163
-
164
-
165
-
166
-
167
-
168
-
169
-
170
-
171
-
172
-
173
-
174
-
175
-
176
-
177
-
178
-
179
-
180
-
181
-
182
-
183
-
184
-
185
-
186
-
187
-
188
-
189
-
190
-
191
-
192
-
193
-
194
-
195
-
196
-
197
-
198
-
199
-
200
-
201
-
202
-
203
-
204
-
205
-
206
-
207
-
208
-
209
-
210
-
211
-
212
-
213
-
214
-
215
-
216
-
217
-
218
-
219
-
220
-
221
-
222
-
223
-
224
-
225
-
226
-
227
-
228
-
229
-
230
-
231
-
232
-
233
-
234
-
235
-
236
-
237
-
238
-
239
-
240
-
241
-
242
-
243
-
244
-
 245
245 -
 246
246 -
 247
247 -
 248
248 -
 249
249 -
 250
250 -
 251
251 -
 252
252 -
 253
253 -
 254
254 -
 255
255 -
 256
256 -
 257
257 -
 258
258 -
 259
259 -
 260
260 -
 261
261 -
 262
262 -
 263
263 -
 264
264 -
 265
265 -
266
-
267
-
268
-
269
-
270
-
271
-
272
-
273
-
274
-
275
-
276
-
277
-
278
-
279
-
280
-
281
-
282
-
283
-
284
-
285
-
286
-
287
-
288
-
289
-
290
-
291
-
292
-
293
-
294
-
295
-
296
-
297
-
298
-
299
-
300
-
301
-
302
-
303
-
304
-
305
-
306
-
307
-
308
-
309
-
310
-
311
-
312
-
313
 |
 |

TYCO INTERNATIONAL LTD.
NOTES TO CONSOLIDATED FINANCIAL STATEMENTS (Continued)
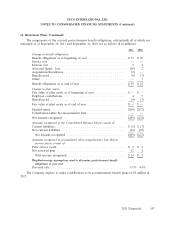
18. Share Plans (Continued)
The grant-date fair value of each option grant is estimated using the Black-Scholes option pricing
model. The fair value is then amortized on a straight-line basis over the requisite service period of the
awards, which is generally the vesting period. Use of a valuation model requires management to make
certain assumptions with respect to selected model inputs. Expected volatility is calculated based on an
analysis of historic and implied volatility measures for a set of peer companies. The average expected
life is based on the contractual term of the option and expected employee exercise and post-vesting
employment termination behavior. The risk-free interest rate is based on U.S. Treasury zero-coupon
issues with a remaining term equal to the expected life assumed at the date of grant. The compensation
expense recognized is net of estimated forfeitures. Forfeitures are estimated based on voluntary
termination behavior, as well as an analysis of actual share option forfeitures. The weighted-average
assumptions used in the Black-Scholes option pricing model for 2011, 2010 and 2009 are as follows:
2011 2010 2009
Expected stock price volatility .................... 33% 34% 32%
Risk Free interest rate .......................... 1.30% 2.50% 2.67%
Expected annual dividend per share ................ $0.84 $0.80 $0.80
Expected life of options (years) ................... 5.2 5.5 5.2
The weighted-average grant-date fair values of options granted during 2011, 2010 and 2009 was
$9.22, $9.18 and $7.09, respectively. The total intrinsic value of options exercised during 2011, 2010 and
2009 was $84 million, $32 million and $0.5 million, respectively. The related excess cash tax benefit
classified as a financing cash inflow for 2011, 2010 and 2009 was not material.
A summary of the option activity as of September 30, 2011, and changes during the year then
ended is presented below:
Weighted-
Average Aggregate
Weighted- Remaining Intrinsic
Average Contractual Term Value
Shares Exercise Price (in years) ($ in millions)
Outstanding as of September 24, 2010 ..... 26,399,389 $42.38
Granted ........................... 4,070,017 37.52
Exercised .......................... (4,621,308) 27.11
Expired ............................ (3,242,911) 68.53
Forfeited ........................... (693,025) 35.16
Outstanding as of September 30, 2011 ..... 21,912,162 41.06 6.1 $92
Vested and unvested expected to vest as of
September 30, 2011 ................. 21,155,733 41.26 6.0 88
Exercisable as of September 30, 2011 ...... 13,035,531 45.68 4.6 34
As of September 30, 2011, there was $44 million of total unrecognized compensation cost related
to non-vested options granted. The cost is expected to be recognized over a weighted-average period of
2.4 fiscal years.
Employee Stock Purchase Plans—The Company’s Employee Stock Purchase Plan (‘‘ESPP’’) was
suspended indefinitely during the year ended September 25, 2009. Prior to that date, substantially all
full-time employees of the Company’s U.S. subsidiaries and employees of certain qualified non-U.S.
152 2011 Financials