ADT 2011 Annual Report Download - page 152
Download and view the complete annual report
Please find page 152 of the 2011 ADT annual report below. You can navigate through the pages in the report by either clicking on the pages listed below, or by using the keyword search tool below to find specific information within the annual report.-
 1
1 -
 2
2 -
 3
3 -
 4
4 -
 5
5 -
 6
6 -
 7
7 -
 8
8 -
 9
9 -
 10
10 -
 11
11 -
 12
12 -
 13
13 -
 14
14 -
 15
15 -
 16
16 -
 17
17 -
 18
18 -
 19
19 -
 20
20 -
 21
21 -
 22
22 -
 23
23 -
 24
24 -
 25
25 -
 26
26 -
 27
27 -
 28
28 -
 29
29 -
 30
30 -
 31
31 -
 32
32 -
 33
33 -
 34
34 -
 35
35 -
 36
36 -
 37
37 -
 38
38 -
 39
39 -
 40
40 -
 41
41 -
 42
42 -
 43
43 -
 44
44 -
 45
45 -
 46
46 -
 47
47 -
 48
48 -
 49
49 -
 50
50 -
 51
51 -
 52
52 -
 53
53 -
 54
54 -
 55
55 -
 56
56 -
 57
57 -
 58
58 -
 59
59 -
 60
60 -
 61
61 -
 62
62 -
 63
63 -
 64
64 -
 65
65 -
 66
66 -
 67
67 -
 68
68 -
 69
69 -
 70
70 -
 71
71 -
 72
72 -
 73
73 -
 74
74 -
 75
75 -
 76
76 -
 77
77 -
 78
78 -
 79
79 -
 80
80 -
 81
81 -
 82
82 -
 83
83 -
 84
84 -
 85
85 -
 86
86 -
 87
87 -
 88
88 -
 89
89 -
 90
90 -
 91
91 -
 92
92 -
 93
93 -
 94
94 -
 95
95 -
 96
96 -
 97
97 -
 98
98 -
 99
99 -
 100
100 -
 101
101 -
 102
102 -
 103
103 -
 104
104 -
 105
105 -
 106
106 -
 107
107 -
 108
108 -
 109
109 -
 110
110 -
 111
111 -
 112
112 -
 113
113 -
 114
114 -
 115
115 -
 116
116 -
 117
117 -
 118
118 -
 119
119 -
 120
120 -
 121
121 -
 122
122 -
 123
123 -
 124
124 -
 125
125 -
 126
126 -
 127
127 -
 128
128 -
 129
129 -
 130
130 -
 131
131 -
 132
132 -
 133
133 -
 134
134 -
 135
135 -
 136
136 -
 137
137 -
 138
138 -
 139
139 -
 140
140 -
 141
141 -
 142
142 -
 143
143 -
 144
144 -
 145
145 -
 146
146 -
 147
147 -
 148
148 -
 149
149 -
 150
150 -
 151
151 -
 152
152 -
 153
153 -
 154
154 -
 155
155 -
 156
156 -
 157
157 -
 158
158 -
 159
159 -
 160
160 -
 161
161 -
 162
162 -
 163
163 -
 164
164 -
 165
165 -
 166
166 -
 167
167 -
 168
168 -
 169
169 -
 170
170 -
 171
171 -
 172
172 -
 173
173 -
 174
174 -
 175
175 -
 176
176 -
 177
177 -
 178
178 -
 179
179 -
 180
180 -
 181
181 -
 182
182 -
 183
183 -
 184
184 -
 185
185 -
 186
186 -
 187
187 -
 188
188 -
 189
189 -
 190
190 -
 191
191 -
 192
192 -
 193
193 -
 194
194 -
 195
195 -
 196
196 -
 197
197 -
 198
198 -
 199
199 -
 200
200 -
 201
201 -
 202
202 -
 203
203 -
 204
204 -
 205
205 -
 206
206 -
 207
207 -
 208
208 -
 209
209 -
 210
210 -
 211
211 -
 212
212 -
 213
213 -
 214
214 -
 215
215 -
 216
216 -
 217
217 -
 218
218 -
 219
219 -
 220
220 -
 221
221 -
 222
222 -
 223
223 -
 224
224 -
 225
225 -
 226
226 -
 227
227 -
 228
228 -
 229
229 -
 230
230 -
 231
231 -
 232
232 -
 233
233 -
 234
234 -
 235
235 -
 236
236 -
 237
237 -
 238
238 -
 239
239 -
 240
240 -
 241
241 -
 242
242 -
 243
243 -
 244
244 -
 245
245 -
 246
246 -
 247
247 -
 248
248 -
 249
249 -
 250
250 -
 251
251 -
 252
252 -
 253
253 -
 254
254 -
 255
255 -
 256
256 -
 257
257 -
 258
258 -
 259
259 -
 260
260 -
 261
261 -
 262
262 -
 263
263 -
 264
264 -
 265
265 -
 266
266 -
 267
267 -
 268
268 -
 269
269 -
 270
270 -
 271
271 -
 272
272 -
 273
273 -
 274
274 -
 275
275 -
 276
276 -
 277
277 -
 278
278 -
 279
279 -
 280
280 -
 281
281 -
 282
282 -
 283
283 -
 284
284 -
 285
285 -
 286
286 -
 287
287 -
 288
288 -
 289
289 -
 290
290 -
 291
291 -
 292
292 -
 293
293 -
 294
294 -
 295
295 -
 296
296 -
 297
297 -
 298
298 -
 299
299 -
 300
300 -
 301
301 -
 302
302 -
 303
303 -
 304
304 -
 305
305 -
 306
306 -
 307
307 -
 308
308 -
 309
309 -
 310
310 -
 311
311 -
 312
312 -
 313
313
 |
 |
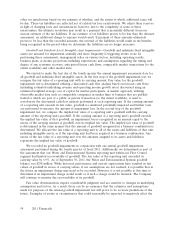
professional fees and banking services. See Note 2 to our Consolidated Financial Statements for further
information.
Corporate expense decreased $108 million, or 18.9%, to $462 million for year ended September 24,
2010 as compared to $570 million for the year ended September 25, 2009. Corporate expense during
2009 was negatively affected by approximately $125 million of charges related to legacy securities
matters partially offset by a $16 million benefit related to a settlement reached with a former executive.
Restructuring charges decreased to $1 million for the year ended September 24, 2010 as compared to
$10 million in the year ended September 25, 2009. Corporate expense was also favorably impacted by
savings realized through cost containment and restructuring charges. These decreases in Corporate
expenses were partially offset by a $52 million net asbestos charge recorded during the third quarter of
2010 as compared to a $37 million net asbestos charge in 2009, both of which were recorded in
conjunction with the valuation of our asbestos-related liabilities and insurance assets. In addition,
$4 million of divestiture charges, net, and $3 million of acquisition costs were recorded during the year
ended September 24, 2010 as compared to $6 million of divestiture charges, net, and nil of acquisition
costs for the year ended September 25, 2009.
Interest Income and Expense
Interest income was $34 million in 2011, as compared to $31 million and $44 million in 2010 and
2009, respectively. Interest income increased in 2011 primarily due to increased investment yields
compared to 2010, while investment yields continue to be lower than those experienced in 2009.
Interest expense was $244 million in 2011, as compared to $284 million and $301 million in 2010
and in 2009, respectively. The weighted-average interest rate on total debt outstanding as of
September 30, 2011, September 24, 2010, September 25, 2009 was 5.9%, 6.3% and 6.6%, respectively.
The decreases in interest expense and weighted-average interest rate are primarily related to savings
realized from the replacement of higher coupon notes with lower coupon notes over the past year,
including the redemption of 6.375% notes due 2011 and issuance of 3.375% notes due 2015 during the
third quarter of 2010 and the maturity of 6.75% notes due 2011 and issuances of the 3.75% notes due
2018 and 4.625% notes due 2023 during the second quarter of 2011.
Other Expense, Net
Other expense, net of $16 million in 2011, primarily relates to our share of Atkore’s net loss of
$9 million, which is accounted for under the equity method of accounting, and a decrease in the receivables
due from Covidien and TE Connectivity under the Tax Sharing Agreement of $7 million. See Note 7 to the
Consolidated Financial Statements.
Other expense, net of $75 million in 2010, primarily related to a charge of $87 million as a loss on
extinguishment of debt on the redemption of our 6.375% public notes due 2011, 7% notes due 2028
and 6.875% notes due 2029. See Note 12 to the Consolidated Financial Statements. This loss was
partially offset by an $8 million gain recorded as a result of an increase in the receivables due from
Covidien and TE Connectivity under the Tax Sharing Agreement.
Other expense, net of $7 million in 2009, primarily related to a $14 million charge recorded as a
result of a decrease in the receivables due from Covidien and TE Connectivity under the Tax Sharing
Agreement, which was partially offset by income of $5 million relating to a gain on derivative contracts
used to economically hedge the foreign currency risk related to the Swiss franc denominated dividends.
Effective Income Tax Rate
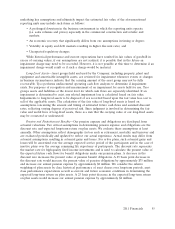
Our effective income tax rate was 17.2% and 10.9% during the years ended September 30, 2011
and September 24, 2010, respectively. The increase in our effective income tax rate was primarily
2011 Financials 49
