ADT 2011 Annual Report Download - page 97
Download and view the complete annual report
Please find page 97 of the 2011 ADT annual report below. You can navigate through the pages in the report by either clicking on the pages listed below, or by using the keyword search tool below to find specific information within the annual report.-
 1
1 -
2
-
3
-
4
-
5
-
6
-
7
-
8
-
9
-
10
-
11
-
12
-
13
-
14
-
15
-
16
-
17
-
18
-
19
-
20
-
21
-
22
-
23
-
24
-
25
-
26
-
27
-
28
-
29
-
30
-
31
-
32
-
33
-
34
-
35
-
36
-
37
-
38
-
39
-
40
-
41
-
42
-
43
-
44
-
45
-
46
-
47
-
48
-
49
-
50
-
51
-
52
-
53
-
54
-
55
-
56
-
57
-
58
-
59
-
60
-
61
-
62
-
63
-
64
-
65
-
66
-
67
-
68
-
69
-
70
-
71
-
72
-
73
-
74
-
75
-
76
-
77
-
78
-
79
-
80
-
81
-
82
-
83
-
84
-
85
-
86
-
 87
87 -
 88
88 -
 89
89 -
 90
90 -
 91
91 -
 92
92 -
 93
93 -
 94
94 -
 95
95 -
 96
96 -
 97
97 -
 98
98 -
 99
99 -
 100
100 -
 101
101 -
 102
102 -
 103
103 -
 104
104 -
 105
105 -
 106
106 -
 107
107 -
108
-
109
-
110
-
111
-
112
-
113
-
114
-
115
-
116
-
117
-
118
-
119
-
120
-
121
-
122
-
123
-
124
-
125
-
126
-
127
-
128
-
129
-
130
-
131
-
132
-
133
-
134
-
135
-
136
-
137
-
138
-
139
-
140
-
141
-
142
-
143
-
144
-
145
-
146
-
147
-
148
-
149
-
150
-
151
-
152
-
153
-
154
-
155
-
156
-
157
-
158
-
159
-
160
-
161
-
162
-
163
-
164
-
165
-
166
-
167
-
168
-
169
-
170
-
171
-
172
-
173
-
174
-
175
-
176
-
177
-
178
-
179
-
180
-
181
-
182
-
183
-
184
-
185
-
186
-
187
-
188
-
189
-
190
-
191
-
192
-
193
-
194
-
195
-
196
-
197
-
198
-
199
-
200
-
201
-
202
-
203
-
204
-
205
-
206
-
207
-
208
-
209
-
210
-
211
-
212
-
213
-
214
-
215
-
216
-
217
-
218
-
219
-
220
-
221
-
222
-
223
-
224
-
225
-
226
-
227
-
228
-
229
-
230
-
231
-
232
-
233
-
234
-
235
-
236
-
237
-
238
-
239
-
240
-
241
-
242
-
243
-
244
-
245
-
246
-
247
-
248
-
249
-
250
-
251
-
252
-
253
-
254
-
255
-
256
-
257
-
258
-
259
-
260
-
261
-
262
-
263
-
264
-
265
-
266
-
267
-
268
-
269
-
270
-
271
-
272
-
273
-
274
-
275
-
276
-
277
-
278
-
279
-
280
-
281
-
282
-
283
-
284
-
285
-
286
-
287
-
288
-
289
-
290
-
291
-
292
-
293
-
294
-
295
-
296
-
297
-
298
-
299
-
300
-
301
-
302
-
303
-
304
-
305
-
306
-
307
-
308
-
309
-
310
-
311
-
312
-
313
 |
 |
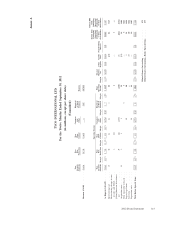
ANNEX A
NON-GAAP MEASURES
Organic revenue, free cash flow (outflow) (FCF), and income from continuing operations before special items
are non-GAAP measures and should not be considered replacements for GAAP results. Organic revenue is a
useful measure used by the company to measure the underlying results and trends in the business. The difference
between reported net revenue (the most comparable GAAP measure) and organic revenue (the non-GAAP
measure) consists of the impact from foreign currency, acquisitions and divestitures, and other changes that do not
reflect the underlying results and trends (for example, revenue reclassifications). Organic revenue and the rate of
organic growth or decline as presented herein may not be comparable to similarly titled measures reported by
other companies. Organic revenue is a useful measure of the company’s performance because it excludes items
that: i) are not completely under management’s control, such as the impact of foreign currency exchange; or ii) do
not reflect the underlying results of the company’s businesses, such as acquisitions and divestitures. It may be used
as a component of the company’s compensation programs. The limitation of this measure is that it excludes items
that have an impact on the company’s revenue. This limitation is best addressed by using organic revenue in
combination with the GAAP numbers.
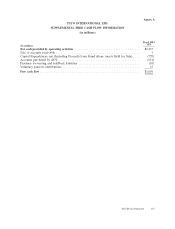
FCF is a useful measure of the company’s cash which is free from any significant existing obligation. The
difference between Cash Flows from Operating Activities (the most comparable GAAP measure) and FCF (the
non-GAAP measure) consists mainly of significant cash flows that the company believes are useful to identify. FCF
permits management and investors to gain insight into the number that management employs to measure cash that
is free from any significant existing obligation. It, or a measure that is based on it, may be used as a component in
the company’s incentive compensation plans. The difference reflects the impact from:
• net capital expenditures,
• accounts purchased by ADT,
• cash paid for purchase accounting and holdback liabilities, voluntary pension contributions, and
• the sale of accounts receivable programs.
Capital expenditures and accounts purchased by ADT are subtracted because they represent long-term
commitments. Cash paid for purchase accounting and holdback liabilities is subtracted because these cash outflows
are not available for general corporate uses. Voluntary pension contributions and the impact from the sale of
accounts receivable programs are added or subtracted because this activity is driven by economic financing
decisions rather than operating activity.
The limitation associated with using FCF is that it adjusts for cash items that are ultimately within
management’s and the Board of Directors’ discretion to direct and therefore may imply that there is less or more
cash that is available for the company’s programs than the most comparable GAAP measure. This limitation is best
addressed by using FCF in combination with the GAAP cash flow numbers. FCF as presented herein may not be
comparable to similarly titled measures reported by other companies. The measure should be used in conjunction
with other GAAP financial measures.
The company has presented its income from continuing operations and margin before special items. Special
items include charges and gains related to divestitures, acquisitions, restructurings, impairments, legacy legal and
tax charges and other income or charges that may mask the underlying operating results and/or business trends of
the company or business segment, as applicable. The company utilizes these measures to assess overall operating
performance and segment level core operating performance, as well as to provide insight to management in
evaluating overall and segment operating plan execution and underlying market conditions. One or more of these
measures may be used as components in the company’s incentive compensation plans. These measures are useful
for investors because they may permit more meaningful comparisons of the company’s underlying operating results
and business trends between periods. The difference between income from continuing operations before special
items and income from continuing operations (the most comparable GAAP measures) consists of the impact of the
special items noted above on the applicable GAAP measure. The limitation of these measures is that they exclude
the impact (which may be material) of items that increase or decrease the company’s reported income from
continuing operations. This limitation is best addressed by using the non-GAAP measures in combination with the
most comparable GAAP measures in order to better understand the amounts, character and impact of any increase
or decrease on reported results.
2012 Proxy Statement A-1