ADT 2011 Annual Report Download - page 60
Download and view the complete annual report
Please find page 60 of the 2011 ADT annual report below. You can navigate through the pages in the report by either clicking on the pages listed below, or by using the keyword search tool below to find specific information within the annual report.-
 1
1 -
2
-
3
-
4
-
5
-
6
-
7
-
8
-
9
-
10
-
11
-
12
-
13
-
14
-
15
-
16
-
17
-
18
-
19
-
20
-
21
-
22
-
23
-
24
-
25
-
26
-
27
-
28
-
29
-
30
-
31
-
32
-
33
-
34
-
35
-
36
-
37
-
38
-
39
-
40
-
41
-
42
-
43
-
44
-
45
-
46
-
47
-
48
-
49
-
 50
50 -
 51
51 -
 52
52 -
 53
53 -
 54
54 -
 55
55 -
 56
56 -
 57
57 -
 58
58 -
 59
59 -
 60
60 -
 61
61 -
 62
62 -
 63
63 -
 64
64 -
 65
65 -
 66
66 -
 67
67 -
 68
68 -
 69
69 -
 70
70 -
71
-
72
-
73
-
74
-
75
-
76
-
77
-
78
-
79
-
80
-
81
-
82
-
83
-
84
-
85
-
86
-
87
-
88
-
89
-
90
-
91
-
92
-
93
-
94
-
95
-
96
-
97
-
98
-
99
-
100
-
101
-
102
-
103
-
104
-
105
-
106
-
107
-
108
-
109
-
110
-
111
-
112
-
113
-
114
-
115
-
116
-
117
-
118
-
119
-
120
-
121
-
122
-
123
-
124
-
125
-
126
-
127
-
128
-
129
-
130
-
131
-
132
-
133
-
134
-
135
-
136
-
137
-
138
-
139
-
140
-
141
-
142
-
143
-
144
-
145
-
146
-
147
-
148
-
149
-
150
-
151
-
152
-
153
-
154
-
155
-
156
-
157
-
158
-
159
-
160
-
161
-
162
-
163
-
164
-
165
-
166
-
167
-
168
-
169
-
170
-
171
-
172
-
173
-
174
-
175
-
176
-
177
-
178
-
179
-
180
-
181
-
182
-
183
-
184
-
185
-
186
-
187
-
188
-
189
-
190
-
191
-
192
-
193
-
194
-
195
-
196
-
197
-
198
-
199
-
200
-
201
-
202
-
203
-
204
-
205
-
206
-
207
-
208
-
209
-
210
-
211
-
212
-
213
-
214
-
215
-
216
-
217
-
218
-
219
-
220
-
221
-
222
-
223
-
224
-
225
-
226
-
227
-
228
-
229
-
230
-
231
-
232
-
233
-
234
-
235
-
236
-
237
-
238
-
239
-
240
-
241
-
242
-
243
-
244
-
245
-
246
-
247
-
248
-
249
-
250
-
251
-
252
-
253
-
254
-
255
-
256
-
257
-
258
-
259
-
260
-
261
-
262
-
263
-
264
-
265
-
266
-
267
-
268
-
269
-
270
-
271
-
272
-
273
-
274
-
275
-
276
-
277
-
278
-
279
-
280
-
281
-
282
-
283
-
284
-
285
-
286
-
287
-
288
-
289
-
290
-
291
-
292
-
293
-
294
-
295
-
296
-
297
-
298
-
299
-
300
-
301
-
302
-
303
-
304
-
305
-
306
-
307
-
308
-
309
-
310
-
311
-
312
-
313
 |
 |

13DEC201119172061
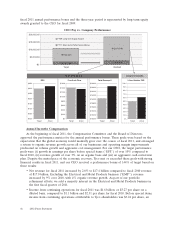
fiscal 2011 annual performance bonus and the three-year period is represented by long term equity
awards granted to the CEO for fiscal 2009:
CEO Pay vs. Company Performance
$2,031,250 $2,925,000
$9,000,000
$15,611,943
$0
$5,000,000
$10,000,000
$15,000,000
$20,000,000
Target Realized
$0.00
$0.50
$1.00
$1.50
$2.00
$2.50
$3.00
$3.50
Target Actual
EPS
$0
$200
$400
$600
$800
$1,000
$1,200
$1,400
$1,600
Target Actual
Free Cash Flow
$15,000
$15,200
$15,400
$15,600
$15,800
$16,000
$16,200
$16,400
$16,600
$16,800
Target Actual
Total Revenue $
0%
10%
20%
30%
40%
50%
60%
70%
80%
90%
100%
Target Actual
3 Year Relative TSR
Short-term Bonus Long-term Awards
FY09 Long-term Equity Award
FY11 Short-term Performance Bonus
Annual Incentive Compensation
At the beginning of fiscal 2011, the Compensation Committee and the Board of Directors
approved the performance metrics for the annual performance bonus. These goals were based on the
expectation that the global economy would modestly grow over the course of fiscal 2011, and envisaged
a return to organic revenue growth across all of our businesses and operating margin improvements
predicated on volume growth and aggressive cost management. For our CEO, the target performance
goals were (i) growth in earnings per share before special items (‘‘EPS’’) of over 10% compared to
fiscal 2010, (ii) revenue growth of over 3% on an organic basis and (iii) an aggressive cash conversion
plan. Despite the muted pace of the economic recovery, Tyco met or exceeded these goals with strong
financial results in fiscal 2011, and our CEO received a performance bonus of 144% of target based on
these results:
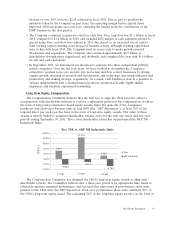
• Net revenue for fiscal 2011 increased by 2.0% to $17.4 billion compared to fiscal 2010 revenue
of $17.0 billion. Excluding the Electrical and Metal Products business (‘‘EMP’’), revenue
increased by 9% over 2010, with 4% organic revenue growth. As part of our portfolio
refinement efforts, we sold a majority interest in the Electrical and Metal Products business in
the first fiscal quarter of 2011.
• Income from continuing operations for fiscal 2011 was $1.6 billion, or $3.27 per share on a
diluted basis, compared to $1.1 billion and $2.31 per share for fiscal 2010. Before special items,
income from continuing operations attributable to Tyco shareholders was $3.24 per share, an
46 2012 Proxy Statement