ADT 2011 Annual Report Download - page 86
Download and view the complete annual report
Please find page 86 of the 2011 ADT annual report below. You can navigate through the pages in the report by either clicking on the pages listed below, or by using the keyword search tool below to find specific information within the annual report.-
 1
1 -
2
-
3
-
4
-
5
-
6
-
7
-
8
-
9
-
10
-
11
-
12
-
13
-
14
-
15
-
16
-
17
-
18
-
19
-
20
-
21
-
22
-
23
-
24
-
25
-
26
-
27
-
28
-
29
-
30
-
31
-
32
-
33
-
34
-
35
-
36
-
37
-
38
-
39
-
40
-
41
-
42
-
43
-
44
-
45
-
46
-
47
-
48
-
49
-
50
-
51
-
52
-
53
-
54
-
55
-
56
-
57
-
58
-
59
-
60
-
61
-
62
-
63
-
64
-
65
-
66
-
67
-
68
-
69
-
70
-
71
-
72
-
73
-
74
-
75
-
 76
76 -
 77
77 -
 78
78 -
 79
79 -
 80
80 -
 81
81 -
 82
82 -
 83
83 -
 84
84 -
 85
85 -
 86
86 -
 87
87 -
 88
88 -
 89
89 -
 90
90 -
 91
91 -
 92
92 -
 93
93 -
 94
94 -
 95
95 -
 96
96 -
97
-
98
-
99
-
100
-
101
-
102
-
103
-
104
-
105
-
106
-
107
-
108
-
109
-
110
-
111
-
112
-
113
-
114
-
115
-
116
-
117
-
118
-
119
-
120
-
121
-
122
-
123
-
124
-
125
-
126
-
127
-
128
-
129
-
130
-
131
-
132
-
133
-
134
-
135
-
136
-
137
-
138
-
139
-
140
-
141
-
142
-
143
-
144
-
145
-
146
-
147
-
148
-
149
-
150
-
151
-
152
-
153
-
154
-
155
-
156
-
157
-
158
-
159
-
160
-
161
-
162
-
163
-
164
-
165
-
166
-
167
-
168
-
169
-
170
-
171
-
172
-
173
-
174
-
175
-
176
-
177
-
178
-
179
-
180
-
181
-
182
-
183
-
184
-
185
-
186
-
187
-
188
-
189
-
190
-
191
-
192
-
193
-
194
-
195
-
196
-
197
-
198
-
199
-
200
-
201
-
202
-
203
-
204
-
205
-
206
-
207
-
208
-
209
-
210
-
211
-
212
-
213
-
214
-
215
-
216
-
217
-
218
-
219
-
220
-
221
-
222
-
223
-
224
-
225
-
226
-
227
-
228
-
229
-
230
-
231
-
232
-
233
-
234
-
235
-
236
-
237
-
238
-
239
-
240
-
241
-
242
-
243
-
244
-
245
-
246
-
247
-
248
-
249
-
250
-
251
-
252
-
253
-
254
-
255
-
256
-
257
-
258
-
259
-
260
-
261
-
262
-
263
-
264
-
265
-
266
-
267
-
268
-
269
-
270
-
271
-
272
-
273
-
274
-
275
-
276
-
277
-
278
-
279
-
280
-
281
-
282
-
283
-
284
-
285
-
286
-
287
-
288
-
289
-
290
-
291
-
292
-
293
-
294
-
295
-
296
-
297
-
298
-
299
-
300
-
301
-
302
-
303
-
304
-
305
-
306
-
307
-
308
-
309
-
310
-
311
-
312
-
313
 |
 |

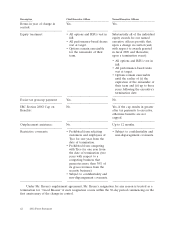
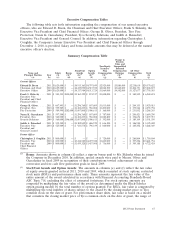
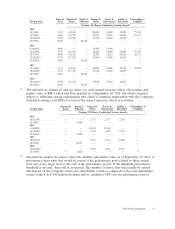
Outstanding Equity Awards at Fiscal Year-End Table
The following table shows, for each of the named executive officers, all equity awards that were
outstanding as of September 30, 2011. Dollar amounts are based on the NYSE closing price of $40.75
for the Company’s common stock on September 30, 2011.
Option Awards Stock Awards
Equity Incentive
Equity Incentive Plan Awards:
Market Plan Awards: Market or
Number of Number of Number of Value of Number of Payout Value of
Securities Securities Shares or Shares or Unearned Unearned
Underlying Underlying Units of Units of Shares, Units Shares, Units
Unexercised Unexercised Option Option Stock That Stock That or Other Rights or Other Rights
Options: (#) Options: (#) Exercise Expiration Have Not Have Not That Have Not That Have Not
Name Exercisable Unexercisable(1) Price ($) Date Vested(2) (#) Vested ($) Vested (#)(3) Vested ($)(3)
(a) (b) (c) (d) (e) (f) (g) (h) (i)
Current Officers
Edward D. Breen ......... 49,749 — $52.43 3/25/2014 479,484 $19,538,973
49,749 — $57.19 3/25/2014
49,749 — $63.55 3/25/2014
49,749 — $58.78 3/9/2015
49,749 — $65.13 3/9/2015
49,749 — $71.49 3/9/2015
124,374 — $46.07 11/21/2015
399,714 — $48.14 11/20/2016
292,000 — $53.36 7/1/2017
277,050 277,050 $29.00 10/6/2018
112,425 337,275 $33.75 9/30/2019
— 471,700 $37.29 10/11/2020
Frank S. Sklarsky ......... — 72,500 $40.85 12/8/2020 56,433 $2,299,645 19,828 $ 807,991
George R. Oliver ......... 62,947 — $43.72 7/9/2016 23,058 $ 939,614 100,622 $ 4,100,347
71,000 — $53.36 7/1/2017
17,500 17,500 $44.49 8/17/2018
64,650 64,650 $29.00 10/6/2018
23,800 71,400 $33.75 9/30/2019
— 79,400 $37.29 10/11/2020
Naren K. Gursahaney ...... 37,768 — $44.16 3/25/2014 23,058 $ 939,614 100,622 $ 4,100,347
31,473 — $56.87 3/9/2015
25,178 — $46.07 11/21/2015
9,442 — $48.67 1/11/2016
88,125 — $48.14 11/20/2016
71,000 — $53.36 7/1/2017
17,500 17,500 $44.49 8/17/2018
64,650 64,650 $29.00 10/6/2018
23,800 71,400 $33.75 9/30/2019
— 79,400 $37.29 10/11/2020
Judith A. Reinsdorf ....... 44,657 — $51.14 5/9/2017 9,310 $ 379,383 80,420 $ 3,277,115
47,000 — $53.36 7/1/2017
49,250 49,250 $29.00 10/6/2018
19,825 59,475 $33.75 9/30/2019
— 67,500 $37.29 10/11/2020
Former Officer
Christopher J. Coughlin ..... 24,874 — $56.60 3/6/2015 — — 163,248 $ 6,652,356
62,187 — $56.87 3/9/2015
62,187 — $46.07 11/21/2015
188,841 — $48.14 11/20/2016
139,000 — $53.36 7/1/2017
92,350 92,350 $29.00 10/6/2018
79,350 238,050 $33.75 9/30/2019
(1) Vesting dates for each outstanding option award for the named executive officers are as follows:
72 2012 Proxy Statement