ADT 2011 Annual Report Download - page 100
Download and view the complete annual report
Please find page 100 of the 2011 ADT annual report below. You can navigate through the pages in the report by either clicking on the pages listed below, or by using the keyword search tool below to find specific information within the annual report.-
 1
1 -
2
-
3
-
4
-
5
-
6
-
7
-
8
-
9
-
10
-
11
-
12
-
13
-
14
-
15
-
16
-
17
-
18
-
19
-
20
-
21
-
22
-
23
-
24
-
25
-
26
-
27
-
28
-
29
-
30
-
31
-
32
-
33
-
34
-
35
-
36
-
37
-
38
-
39
-
40
-
41
-
42
-
43
-
44
-
45
-
46
-
47
-
48
-
49
-
50
-
51
-
52
-
53
-
54
-
55
-
56
-
57
-
58
-
59
-
60
-
61
-
62
-
63
-
64
-
65
-
66
-
67
-
68
-
69
-
70
-
71
-
72
-
73
-
74
-
75
-
76
-
77
-
78
-
79
-
80
-
81
-
82
-
83
-
84
-
85
-
86
-
87
-
88
-
89
-
 90
90 -
 91
91 -
 92
92 -
 93
93 -
 94
94 -
 95
95 -
 96
96 -
 97
97 -
 98
98 -
 99
99 -
 100
100 -
 101
101 -
 102
102 -
 103
103 -
 104
104 -
 105
105 -
 106
106 -
 107
107 -
 108
108 -
 109
109 -
 110
110 -
111
-
112
-
113
-
114
-
115
-
116
-
117
-
118
-
119
-
120
-
121
-
122
-
123
-
124
-
125
-
126
-
127
-
128
-
129
-
130
-
131
-
132
-
133
-
134
-
135
-
136
-
137
-
138
-
139
-
140
-
141
-
142
-
143
-
144
-
145
-
146
-
147
-
148
-
149
-
150
-
151
-
152
-
153
-
154
-
155
-
156
-
157
-
158
-
159
-
160
-
161
-
162
-
163
-
164
-
165
-
166
-
167
-
168
-
169
-
170
-
171
-
172
-
173
-
174
-
175
-
176
-
177
-
178
-
179
-
180
-
181
-
182
-
183
-
184
-
185
-
186
-
187
-
188
-
189
-
190
-
191
-
192
-
193
-
194
-
195
-
196
-
197
-
198
-
199
-
200
-
201
-
202
-
203
-
204
-
205
-
206
-
207
-
208
-
209
-
210
-
211
-
212
-
213
-
214
-
215
-
216
-
217
-
218
-
219
-
220
-
221
-
222
-
223
-
224
-
225
-
226
-
227
-
228
-
229
-
230
-
231
-
232
-
233
-
234
-
235
-
236
-
237
-
238
-
239
-
240
-
241
-
242
-
243
-
244
-
245
-
246
-
247
-
248
-
249
-
250
-
251
-
252
-
253
-
254
-
255
-
256
-
257
-
258
-
259
-
260
-
261
-
262
-
263
-
264
-
265
-
266
-
267
-
268
-
269
-
270
-
271
-
272
-
273
-
274
-
275
-
276
-
277
-
278
-
279
-
280
-
281
-
282
-
283
-
284
-
285
-
286
-
287
-
288
-
289
-
290
-
291
-
292
-
293
-
294
-
295
-
296
-
297
-
298
-
299
-
300
-
301
-
302
-
303
-
304
-
305
-
306
-
307
-
308
-
309
-
310
-
311
-
312
-
313
 |
 |

A-4 2012 Proxy Statement
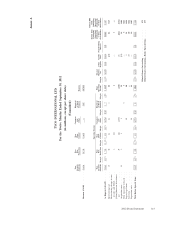
Annex A
TYCO INTERNATIONAL LTD.
For the Twelve Months Ended September 24, 2010
(in millions, except per share data)
(Unaudited)
Tyco Tyco Tyco Corporate Electrical
Security Fire Flow Safety and & Metal
Solutions Protection Control Products Other Products Revenue
Previously Reported Revenue . . . . $7,376 $3,355 $3,373 $ 1,513 — $1,399 $17,016
Segment Realignment ........ 358 1,155 (1,513) — — —
Recasted (GAAP) .......... $7,734 $4,510 $3,373 — — $1,399 $17,016
Diluted EPS
Income from from
Continuing Continuing
Operating Income Operations Operations
Tyco Tyco Tyco Corporate Electrical Total Interest Other Attributable Attributable
Security Fire Flow Safety and & Metal Operating Expense, Income, Income Noncontrolling to Tyco to Tyco
Solutions Margin Protection Margin Control Margin Products Margin Other Margin Products Margin Income Margin net net Taxes Interest Shareholders Shareholders
As Previously Reported (GAAP) . . . . $ 1,056 14.3% $ 272 8.1% $ 410 12.2% $ 221 14.6% $ (461) N/M $ 100 7.1% $ 1,598 9.4% $ (253) $ (75) $ (138) $ (7) $ 1,125 $ 2.31
Segment Realignment ......... 34 188 (221) (1) — — — — — — — —
Recasted (GAAP) ........... $1,090 14.1% $ 460 10.2% $ 410 12.2% — — $ (462) N/M $ 100 7.1% $ 1,598 9.4% $ (253) $ (75) $ (138) $(7) $ 1,125 $ 2.31
Restructuring, net ........... 62 40 25 — 1 6 134 — — (42) — 92 0.19
Restructuring charges in cost of sales
and SG&A............. — 2 — — — 7 9 — — (3) — 6 0.01
——
Other additional charges resulting from
restructuring actions ........ — — 1 — — — 1 — — — — 1 —
ERISA insurance recovery ....... — — — — (1) — (1) — — — — (1) —
Acquisition costs ........... 32 — — — 3 — 35 — — (11) — 24 0.05
Asset impairments and (gains) / losses
on divestitures, net ......... (44) 2 (1) — 4 1 (38) — — (4) — (42) (0.09)
Separation Costs ........... — — — — 10 — 10 — — (1) — 9 0.02
Loss on extinguishment of Debt . . . . — — — — — — — — 87 (25) — 62 0.13
Tax items ............... — — — — — — — — — 32 — 32 0.06
Total Before Special Items ...... $1,140 14.7% $ 504 11.2% $ 435 12.9% — — $ (445) N/M $ 114 8.1% $ 1,748 10.3% $ (253) $ 12 $ (192) $ (7) $ 1,308 $ 2.68