ADT 2011 Annual Report Download - page 164
Download and view the complete annual report
Please find page 164 of the 2011 ADT annual report below. You can navigate through the pages in the report by either clicking on the pages listed below, or by using the keyword search tool below to find specific information within the annual report.-
 1
1 -
2
-
3
-
4
-
5
-
6
-
7
-
8
-
9
-
10
-
11
-
12
-
13
-
14
-
15
-
16
-
17
-
18
-
19
-
20
-
21
-
22
-
23
-
24
-
25
-
26
-
27
-
28
-
29
-
30
-
31
-
32
-
33
-
34
-
35
-
36
-
37
-
38
-
39
-
40
-
41
-
42
-
43
-
44
-
45
-
46
-
47
-
48
-
49
-
50
-
51
-
52
-
53
-
54
-
55
-
56
-
57
-
58
-
59
-
60
-
61
-
62
-
63
-
64
-
65
-
66
-
67
-
68
-
69
-
70
-
71
-
72
-
73
-
74
-
75
-
76
-
77
-
78
-
79
-
80
-
81
-
82
-
83
-
84
-
85
-
86
-
87
-
88
-
89
-
90
-
91
-
92
-
93
-
94
-
95
-
96
-
97
-
98
-
99
-
100
-
101
-
102
-
103
-
104
-
105
-
106
-
107
-
108
-
109
-
110
-
111
-
112
-
113
-
114
-
115
-
116
-
117
-
118
-
119
-
120
-
121
-
122
-
123
-
124
-
125
-
126
-
127
-
128
-
129
-
130
-
131
-
132
-
133
-
134
-
135
-
136
-
137
-
138
-
139
-
140
-
141
-
142
-
143
-
144
-
145
-
146
-
147
-
148
-
149
-
150
-
151
-
152
-
153
-
 154
154 -
 155
155 -
 156
156 -
 157
157 -
 158
158 -
 159
159 -
 160
160 -
 161
161 -
 162
162 -
 163
163 -
 164
164 -
 165
165 -
 166
166 -
 167
167 -
 168
168 -
 169
169 -
 170
170 -
 171
171 -
 172
172 -
 173
173 -
 174
174 -
175
-
176
-
177
-
178
-
179
-
180
-
181
-
182
-
183
-
184
-
185
-
186
-
187
-
188
-
189
-
190
-
191
-
192
-
193
-
194
-
195
-
196
-
197
-
198
-
199
-
200
-
201
-
202
-
203
-
204
-
205
-
206
-
207
-
208
-
209
-
210
-
211
-
212
-
213
-
214
-
215
-
216
-
217
-
218
-
219
-
220
-
221
-
222
-
223
-
224
-
225
-
226
-
227
-
228
-
229
-
230
-
231
-
232
-
233
-
234
-
235
-
236
-
237
-
238
-
239
-
240
-
241
-
242
-
243
-
244
-
245
-
246
-
247
-
248
-
249
-
250
-
251
-
252
-
253
-
254
-
255
-
256
-
257
-
258
-
259
-
260
-
261
-
262
-
263
-
264
-
265
-
266
-
267
-
268
-
269
-
270
-
271
-
272
-
273
-
274
-
275
-
276
-
277
-
278
-
279
-
280
-
281
-
282
-
283
-
284
-
285
-
286
-
287
-
288
-
289
-
290
-
291
-
292
-
293
-
294
-
295
-
296
-
297
-
298
-
299
-
300
-
301
-
302
-
303
-
304
-
305
-
306
-
307
-
308
-
309
-
310
-
311
-
312
-
313
 |
 |

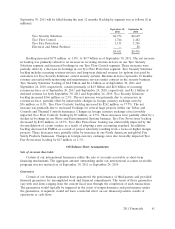
September 30, 2011 will be filled during the next 12 months. Backlog by segment was as follows ($ in
millions):
September 30, September 24,
2011 2010
Tyco Security Solutions ......................... $6,776 $6,610
Tyco Flow Control ............................ 1,744 1,482
Tyco Fire Protection ........................... 1,131 1,296
Electrical and Metal Products .................... — 88
$9,651 $9,476
Backlog increased $175 million, or 1.8%, to $9.7 billion as of September 30, 2011. The net increase
in backlog was primarily related to an increase in recurring revenue-in-force in our Tyco Security
Solutions segment and increased bookings in our Tyco Flow Control segment. These increases were
partially offset by a decrease in bookings in our Tyco Fire Protection segment. Tyco Security Solutions’
backlog includes recurring revenue-in-force and long-term deferred revenue for upfront fees paid by
customers for Tyco Security Solutions’ owned security systems. Revenue-in-force represents 12 months’
revenue associated with monitoring and maintenance services under contract in the security business.
Tyco Security Solutions’ backlog of $6.8 billion and $6.6 billion as of September 30, 2011 and
September 24, 2010, respectively, consists primarily of $4.9 billion and $4.8 billion of recurring
revenue-in-force as of September 30, 2011 and September 24, 2010, respectively, and $1.1 billion of
deferred revenue for both September 30, 2011 and September 24, 2010. Tyco Security Solutions’
backlog increased $166 million, or 2.5%. The net increase was primarily due to an increase in
revenue-in-force, partially offset by unfavorable changes in foreign currency exchange rates by
$36 million, or 0.5%. Tyco Flow Controls’ backlog increased by $262 million, or 17.7%. The net
increase was primarily due to increased bookings for several large projects within our Valves and
Controls and Thermal Controls businesses. Changes in foreign currency exchange rates favorably
impacted Tyco Flow Controls’ backlog by $7 million, or 0.5%. These increases were partially offset by a
decline in bookings in our Water and Environmental Systems business. Tyco Fire Protections’ backlog
decreased by $165 million, or 12.7%. Tyco Fire Protections’ backlog was unfavorably impacted by the
deconsolidation of a joint venture as a result of adopting a new accounting standard. In addition,
backlog decreased in EMEA as a result of project selectivity resulting from a focus on higher margin
projects. These decreases were partially offset by increases in our North American and global Fire
Safety Products businesses. Changes in foreign currency exchange rates also favorably impacted Tyco
Fire Protections’ backlog by $17 million, or 1.3%.
Off-Balance Sheet Arrangements
Sale of Accounts Receivable
Certain of our international businesses utilize the sale of accounts receivable as short-term
financing mechanisms. The aggregate amount outstanding under our international accounts receivable
programs was not material as of September 30, 2011 or September 24, 2010.
Guarantees
Certain of our business segments have guaranteed the performance of third-parties and provided
financial guarantees for uncompleted work and financial commitments. The terms of these guarantees
vary with end dates ranging from the current fiscal year through the completion of such transactions.
The guarantees would typically be triggered in the event of nonperformance and performance under
the guarantees, if required, would not have a material effect on our financial position, results of
operations or cash flows.
2011 Financials 61