ADT 2011 Annual Report Download - page 241
Download and view the complete annual report
Please find page 241 of the 2011 ADT annual report below. You can navigate through the pages in the report by either clicking on the pages listed below, or by using the keyword search tool below to find specific information within the annual report.-
 1
1 -
2
-
3
-
4
-
5
-
6
-
7
-
8
-
9
-
10
-
11
-
12
-
13
-
14
-
15
-
16
-
17
-
18
-
19
-
20
-
21
-
22
-
23
-
24
-
25
-
26
-
27
-
28
-
29
-
30
-
31
-
32
-
33
-
34
-
35
-
36
-
37
-
38
-
39
-
40
-
41
-
42
-
43
-
44
-
45
-
46
-
47
-
48
-
49
-
50
-
51
-
52
-
53
-
54
-
55
-
56
-
57
-
58
-
59
-
60
-
61
-
62
-
63
-
64
-
65
-
66
-
67
-
68
-
69
-
70
-
71
-
72
-
73
-
74
-
75
-
76
-
77
-
78
-
79
-
80
-
81
-
82
-
83
-
84
-
85
-
86
-
87
-
88
-
89
-
90
-
91
-
92
-
93
-
94
-
95
-
96
-
97
-
98
-
99
-
100
-
101
-
102
-
103
-
104
-
105
-
106
-
107
-
108
-
109
-
110
-
111
-
112
-
113
-
114
-
115
-
116
-
117
-
118
-
119
-
120
-
121
-
122
-
123
-
124
-
125
-
126
-
127
-
128
-
129
-
130
-
131
-
132
-
133
-
134
-
135
-
136
-
137
-
138
-
139
-
140
-
141
-
142
-
143
-
144
-
145
-
146
-
147
-
148
-
149
-
150
-
151
-
152
-
153
-
154
-
155
-
156
-
157
-
158
-
159
-
160
-
161
-
162
-
163
-
164
-
165
-
166
-
167
-
168
-
169
-
170
-
171
-
172
-
173
-
174
-
175
-
176
-
177
-
178
-
179
-
180
-
181
-
182
-
183
-
184
-
185
-
186
-
187
-
188
-
189
-
190
-
191
-
192
-
193
-
194
-
195
-
196
-
197
-
198
-
199
-
200
-
201
-
202
-
203
-
204
-
205
-
206
-
207
-
208
-
209
-
210
-
211
-
212
-
213
-
214
-
215
-
216
-
217
-
218
-
219
-
220
-
221
-
222
-
223
-
224
-
225
-
226
-
227
-
228
-
229
-
230
-
 231
231 -
 232
232 -
 233
233 -
 234
234 -
 235
235 -
 236
236 -
 237
237 -
 238
238 -
 239
239 -
 240
240 -
 241
241 -
 242
242 -
 243
243 -
 244
244 -
 245
245 -
 246
246 -
 247
247 -
 248
248 -
 249
249 -
 250
250 -
 251
251 -
252
-
253
-
254
-
255
-
256
-
257
-
258
-
259
-
260
-
261
-
262
-
263
-
264
-
265
-
266
-
267
-
268
-
269
-
270
-
271
-
272
-
273
-
274
-
275
-
276
-
277
-
278
-
279
-
280
-
281
-
282
-
283
-
284
-
285
-
286
-
287
-
288
-
289
-
290
-
291
-
292
-
293
-
294
-
295
-
296
-
297
-
298
-
299
-
300
-
301
-
302
-
303
-
304
-
305
-
306
-
307
-
308
-
309
-
310
-
311
-
312
-
313
 |
 |

TYCO INTERNATIONAL LTD.
NOTES TO CONSOLIDATED FINANCIAL STATEMENTS (Continued)
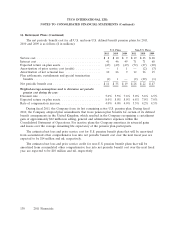
16. Retirement Plans (Continued)
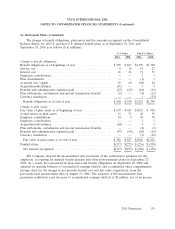
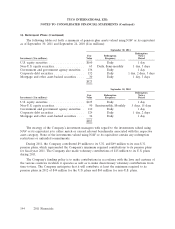
The net periodic benefit cost for all U.S. and non-U.S. defined benefit pension plans for 2011,
2010 and 2009 is as follows ($ in millions):
U.S. Plans Non-U.S. Plans
2011 2010 2009 2011 2010 2009
Service cost .................................... $ 8 $10 $ 9 $19 $23 $28
Interest cost .................................... 41 46 49 71 71 68
Expected return on plan assets ....................... (47) (49) (49) (72) (67) (60)
Amortization of prior service cost (credit) .............. — 1 1 — (2) (3)
Amortization of net actuarial loss .................... 10 26 9 12 26 15
Plan settlements, curtailments and special termination
benefits ...................................... (1) 1 — (2) (29) (1)
Net periodic benefit cost ........................... $11 $35 $19 $28 $22 $47
Weighted-average assumptions used to determine net periodic
pension cost during the year:
Discount rate ................................... 5.0% 5.5% 7.6% 5.0% 5.6% 6.5%
Expected return on plan assets ....................... 8.0% 8.0% 8.0% 6.8% 7.0% 7.0%
Rate of compensation increase ....................... 4.0% 4.0% 4.0% 3.5% 4.2% 4.5%
During fiscal 2011, the Company froze its last remaining active U.S. pension plan. During fiscal
2010, the Company adopted plan amendments that froze pension plan benefits for certain of its defined
benefit arrangements in the United Kingdom, which resulted in the Company recognizing a curtailment
gain of approximately $22 million in selling, general and administrative expenses within the
Consolidated Statement of Operations. For inactive plans the Company amortizes its actuarial gains
and losses over the average remaining life expectancy of the pension plan participants.
The estimated net loss and prior service cost for U.S. pension benefit plans that will be amortized
from accumulated other comprehensive loss into net periodic benefit cost over the next fiscal year are
expected to be $14 million and nil, respectively.
The estimated net loss and prior service credit for non-U.S. pension benefit plans that will be
amortized from accumulated other comprehensive loss into net periodic benefit cost over the next fiscal
year are expected to be $10 million and nil, respectively.
138 2011 Financials