ADT 2011 Annual Report Download - page 142
Download and view the complete annual report
Please find page 142 of the 2011 ADT annual report below. You can navigate through the pages in the report by either clicking on the pages listed below, or by using the keyword search tool below to find specific information within the annual report.-
 1
1 -
2
-
3
-
4
-
5
-
6
-
7
-
8
-
9
-
10
-
11
-
12
-
13
-
14
-
15
-
16
-
17
-
18
-
19
-
20
-
21
-
22
-
23
-
24
-
25
-
26
-
27
-
28
-
29
-
30
-
31
-
32
-
33
-
34
-
35
-
36
-
37
-
38
-
39
-
40
-
41
-
42
-
43
-
44
-
45
-
46
-
47
-
48
-
49
-
50
-
51
-
52
-
53
-
54
-
55
-
56
-
57
-
58
-
59
-
60
-
61
-
62
-
63
-
64
-
65
-
66
-
67
-
68
-
69
-
70
-
71
-
72
-
73
-
74
-
75
-
76
-
77
-
78
-
79
-
80
-
81
-
82
-
83
-
84
-
85
-
86
-
87
-
88
-
89
-
90
-
91
-
92
-
93
-
94
-
95
-
96
-
97
-
98
-
99
-
100
-
101
-
102
-
103
-
104
-
105
-
106
-
107
-
108
-
109
-
110
-
111
-
112
-
113
-
114
-
115
-
116
-
117
-
118
-
119
-
120
-
121
-
122
-
123
-
124
-
125
-
126
-
127
-
128
-
129
-
130
-
131
-
 132
132 -
 133
133 -
 134
134 -
 135
135 -
 136
136 -
 137
137 -
 138
138 -
 139
139 -
 140
140 -
 141
141 -
 142
142 -
 143
143 -
 144
144 -
 145
145 -
 146
146 -
 147
147 -
 148
148 -
 149
149 -
 150
150 -
 151
151 -
 152
152 -
153
-
154
-
155
-
156
-
157
-
158
-
159
-
160
-
161
-
162
-
163
-
164
-
165
-
166
-
167
-
168
-
169
-
170
-
171
-
172
-
173
-
174
-
175
-
176
-
177
-
178
-
179
-
180
-
181
-
182
-
183
-
184
-
185
-
186
-
187
-
188
-
189
-
190
-
191
-
192
-
193
-
194
-
195
-
196
-
197
-
198
-
199
-
200
-
201
-
202
-
203
-
204
-
205
-
206
-
207
-
208
-
209
-
210
-
211
-
212
-
213
-
214
-
215
-
216
-
217
-
218
-
219
-
220
-
221
-
222
-
223
-
224
-
225
-
226
-
227
-
228
-
229
-
230
-
231
-
232
-
233
-
234
-
235
-
236
-
237
-
238
-
239
-
240
-
241
-
242
-
243
-
244
-
245
-
246
-
247
-
248
-
249
-
250
-
251
-
252
-
253
-
254
-
255
-
256
-
257
-
258
-
259
-
260
-
261
-
262
-
263
-
264
-
265
-
266
-
267
-
268
-
269
-
270
-
271
-
272
-
273
-
274
-
275
-
276
-
277
-
278
-
279
-
280
-
281
-
282
-
283
-
284
-
285
-
286
-
287
-
288
-
289
-
290
-
291
-
292
-
293
-
294
-
295
-
296
-
297
-
298
-
299
-
300
-
301
-
302
-
303
-
304
-
305
-
306
-
307
-
308
-
309
-
310
-
311
-
312
-
313
 |
 |

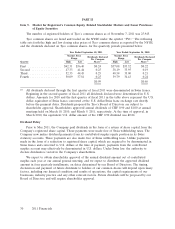
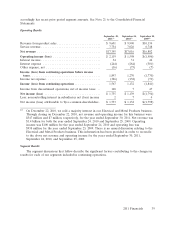
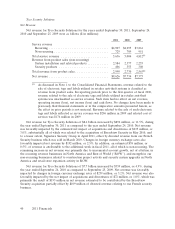
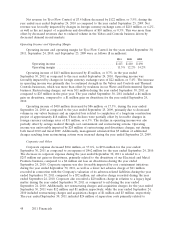
accordingly has recast prior period segment amounts. See Note 21 to the Consolidated Financial
Statements.
Operating Results
September 30, September 24, September 25,
2011(1) 2010(1) 2009(1)
Revenue from product sales ......................... $ 9,601 $ 9,990 $10,134
Service revenue .................................. 7,754 7,026 6,748
Net revenue .................................... $17,355 $17,016 $16,882
Operating income (loss) ........................... $ 2,119 $ 1,598 $ (1,506)
Interest income .................................. 34 31 44
Interest expense ................................. (244) (284) (301)
Other expense, net ............................... (16) (75) (7)
Income (loss) from continuing operations before income
taxes ........................................ 1,893 1,270 (1,770)
Income tax expense ............................... (326) (138) (71)
Income (loss) from continuing operations ............... 1,567 1,132 (1,841)
Income from discontinued operations, net of income taxes . . 168 7 47
Net income (loss) ................................ $ 1,735 $ 1,139 $(1,794)
Less: noncontrolling interest in subsidiaries net (loss) income 2 7 4
Net income (loss) attributable to Tyco common shareholders . $ 1,733 $ 1,132 $(1,798)
(1) On December 22, 2010, we sold a majority interest in our Electrical and Metal Products business.
Through closing on December 22, 2010, net revenue and operating income for this business were
$347 million and $7 million, respectively, for the year ended September 30, 2011. Net revenue was
$1.4 billion for both the year ended September 24, 2010 and September 25, 2009. Operating
income was $100 million for the year ended September 24, 2010 and operating loss was
$938 million for the year ended September 25, 2009. There is no annual discussion relating to the
Electrical and Metal Products business. This information has been provided in order to reconcile
to the above net revenue and operating income for the years ended September 30, 2011,
September 24, 2010, and September 25, 2009.
Segment Results
The segment discussions that follow describe the significant factors contributing to the changes in
results for each of our segments included in continuing operations.
2011 Financials 39