ADT 2011 Annual Report Download - page 211
Download and view the complete annual report
Please find page 211 of the 2011 ADT annual report below. You can navigate through the pages in the report by either clicking on the pages listed below, or by using the keyword search tool below to find specific information within the annual report.-
 1
1 -
2
-
3
-
4
-
5
-
6
-
7
-
8
-
9
-
10
-
11
-
12
-
13
-
14
-
15
-
16
-
17
-
18
-
19
-
20
-
21
-
22
-
23
-
24
-
25
-
26
-
27
-
28
-
29
-
30
-
31
-
32
-
33
-
34
-
35
-
36
-
37
-
38
-
39
-
40
-
41
-
42
-
43
-
44
-
45
-
46
-
47
-
48
-
49
-
50
-
51
-
52
-
53
-
54
-
55
-
56
-
57
-
58
-
59
-
60
-
61
-
62
-
63
-
64
-
65
-
66
-
67
-
68
-
69
-
70
-
71
-
72
-
73
-
74
-
75
-
76
-
77
-
78
-
79
-
80
-
81
-
82
-
83
-
84
-
85
-
86
-
87
-
88
-
89
-
90
-
91
-
92
-
93
-
94
-
95
-
96
-
97
-
98
-
99
-
100
-
101
-
102
-
103
-
104
-
105
-
106
-
107
-
108
-
109
-
110
-
111
-
112
-
113
-
114
-
115
-
116
-
117
-
118
-
119
-
120
-
121
-
122
-
123
-
124
-
125
-
126
-
127
-
128
-
129
-
130
-
131
-
132
-
133
-
134
-
135
-
136
-
137
-
138
-
139
-
140
-
141
-
142
-
143
-
144
-
145
-
146
-
147
-
148
-
149
-
150
-
151
-
152
-
153
-
154
-
155
-
156
-
157
-
158
-
159
-
160
-
161
-
162
-
163
-
164
-
165
-
166
-
167
-
168
-
169
-
170
-
171
-
172
-
173
-
174
-
175
-
176
-
177
-
178
-
179
-
180
-
181
-
182
-
183
-
184
-
185
-
186
-
187
-
188
-
189
-
190
-
191
-
192
-
193
-
194
-
195
-
196
-
197
-
198
-
199
-
200
-
 201
201 -
 202
202 -
 203
203 -
 204
204 -
 205
205 -
 206
206 -
 207
207 -
 208
208 -
 209
209 -
 210
210 -
 211
211 -
 212
212 -
 213
213 -
 214
214 -
 215
215 -
 216
216 -
 217
217 -
 218
218 -
 219
219 -
 220
220 -
 221
221 -
222
-
223
-
224
-
225
-
226
-
227
-
228
-
229
-
230
-
231
-
232
-
233
-
234
-
235
-
236
-
237
-
238
-
239
-
240
-
241
-
242
-
243
-
244
-
245
-
246
-
247
-
248
-
249
-
250
-
251
-
252
-
253
-
254
-
255
-
256
-
257
-
258
-
259
-
260
-
261
-
262
-
263
-
264
-
265
-
266
-
267
-
268
-
269
-
270
-
271
-
272
-
273
-
274
-
275
-
276
-
277
-
278
-
279
-
280
-
281
-
282
-
283
-
284
-
285
-
286
-
287
-
288
-
289
-
290
-
291
-
292
-
293
-
294
-
295
-
296
-
297
-
298
-
299
-
300
-
301
-
302
-
303
-
304
-
305
-
306
-
307
-
308
-
309
-
310
-
311
-
312
-
313
 |
 |

TYCO INTERNATIONAL LTD.
NOTES TO CONSOLIDATED FINANCIAL STATEMENTS (Continued)
7. Income Taxes (Continued)
Included in the nondeductible charges for 2009 is the loss driven by the goodwill impairment
charges of $2.6 billion, for which almost no tax benefit is available.
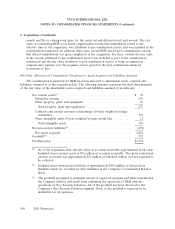
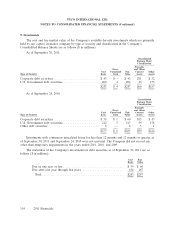
Deferred income taxes result from temporary differences between the amount of assets and
liabilities recognized for financial reporting and tax purposes. The components of the net deferred
income tax asset as of September 30, 2011 and September 24, 2010 are as follows ($ in millions):
2011 2010
Deferred tax assets:
Accrued liabilities and reserves ........................ $ 169 $ 243
Tax loss and credit carryforwards ...................... 2,381 2,491
Postretirement benefits .............................. 301 318
Deferred revenue .................................. 302 200
Other .......................................... 554 483
$ 3,707 $ 3,735
Deferred tax liabilities:
Property, plant and equipment ........................ (657) (711)
Intangibles assets .................................. (672) (676)
Other .......................................... (195) (122)
$(1,524) $(1,509)
Net deferred tax asset before valuation allowance ............ 2,183 2,226
Valuation allowance ................................. (1,400) (1,379)
Net deferred tax asset ................................ $ 783 $ 847
The valuation allowance for deferred tax assets of $1,400 million and $1,379 million as of
September 30, 2011 and September 24, 2010, respectively, relates principally to the uncertainty of the
utilization of certain deferred tax assets, primarily tax loss and credit carryforwards in various
jurisdictions. The valuation allowance was calculated and recorded when the Company determined that
it was more-likely-than-not that all or a portion of our deferred tax assets would not be realized. The
Company believes that it will generate sufficient future taxable income to realize the tax benefits
related to the remaining net deferred tax assets on the Company’s Consolidated Balance Sheets.
As of September 30, 2011, the Company had $6,277 million of net operating loss carryforwards in
certain non-U.S. jurisdictions. Of these, $5,411 million have no expiration, and the remaining
$866 million will expire in future years through 2030. In the U.S., there were approximately
$1,814 million of federal and $1,536 million of state net operating loss carryforwards as of
September 30, 2011, which will expire in future years through 2030.
As of September 30, 2011 and September 24, 2010, Tyco had unrecognized tax benefits of
$270 million and $318 million, respectively, of which $241 million and $276 million, if recognized,
would affect the effective tax rate. Tyco recognizes interest and penalties accrued related to
unrecognized tax benefits in income tax expense. Tyco had accrued interest and penalties related to the
unrecognized tax benefits of $60 million and $63 million as of September 30, 2011 and September 24,
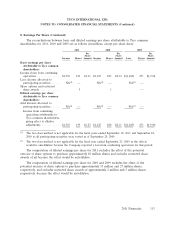
2010, respectively. Tyco recognized $4 million, $13 million and $1 million of income tax expense for
108 2011 Financials