ADT 2011 Annual Report Download - page 167
Download and view the complete annual report
Please find page 167 of the 2011 ADT annual report below. You can navigate through the pages in the report by either clicking on the pages listed below, or by using the keyword search tool below to find specific information within the annual report.-
 1
1 -
2
-
3
-
4
-
5
-
6
-
7
-
8
-
9
-
10
-
11
-
12
-
13
-
14
-
15
-
16
-
17
-
18
-
19
-
20
-
21
-
22
-
23
-
24
-
25
-
26
-
27
-
28
-
29
-
30
-
31
-
32
-
33
-
34
-
35
-
36
-
37
-
38
-
39
-
40
-
41
-
42
-
43
-
44
-
45
-
46
-
47
-
48
-
49
-
50
-
51
-
52
-
53
-
54
-
55
-
56
-
57
-
58
-
59
-
60
-
61
-
62
-
63
-
64
-
65
-
66
-
67
-
68
-
69
-
70
-
71
-
72
-
73
-
74
-
75
-
76
-
77
-
78
-
79
-
80
-
81
-
82
-
83
-
84
-
85
-
86
-
87
-
88
-
89
-
90
-
91
-
92
-
93
-
94
-
95
-
96
-
97
-
98
-
99
-
100
-
101
-
102
-
103
-
104
-
105
-
106
-
107
-
108
-
109
-
110
-
111
-
112
-
113
-
114
-
115
-
116
-
117
-
118
-
119
-
120
-
121
-
122
-
123
-
124
-
125
-
126
-
127
-
128
-
129
-
130
-
131
-
132
-
133
-
134
-
135
-
136
-
137
-
138
-
139
-
140
-
141
-
142
-
143
-
144
-
145
-
146
-
147
-
148
-
149
-
150
-
151
-
152
-
153
-
154
-
155
-
156
-
 157
157 -
 158
158 -
 159
159 -
 160
160 -
 161
161 -
 162
162 -
 163
163 -
 164
164 -
 165
165 -
 166
166 -
 167
167 -
 168
168 -
 169
169 -
 170
170 -
 171
171 -
 172
172 -
 173
173 -
 174
174 -
 175
175 -
 176
176 -
 177
177 -
178
-
179
-
180
-
181
-
182
-
183
-
184
-
185
-
186
-
187
-
188
-
189
-
190
-
191
-
192
-
193
-
194
-
195
-
196
-
197
-
198
-
199
-
200
-
201
-
202
-
203
-
204
-
205
-
206
-
207
-
208
-
209
-
210
-
211
-
212
-
213
-
214
-
215
-
216
-
217
-
218
-
219
-
220
-
221
-
222
-
223
-
224
-
225
-
226
-
227
-
228
-
229
-
230
-
231
-
232
-
233
-
234
-
235
-
236
-
237
-
238
-
239
-
240
-
241
-
242
-
243
-
244
-
245
-
246
-
247
-
248
-
249
-
250
-
251
-
252
-
253
-
254
-
255
-
256
-
257
-
258
-
259
-
260
-
261
-
262
-
263
-
264
-
265
-
266
-
267
-
268
-
269
-
270
-
271
-
272
-
273
-
274
-
275
-
276
-
277
-
278
-
279
-
280
-
281
-
282
-
283
-
284
-
285
-
286
-
287
-
288
-
289
-
290
-
291
-
292
-
293
-
294
-
295
-
296
-
297
-
298
-
299
-
300
-
301
-
302
-
303
-
304
-
305
-
306
-
307
-
308
-
309
-
310
-
311
-
312
-
313
 |
 |
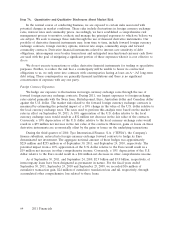
Item 7A. Quantitative and Qualitative Disclosures About Market Risk
In the normal course of conducting business, we are exposed to certain risks associated with
potential changes in market conditions. These risks include fluctuations in foreign currency exchange
rates, interest rates and commodity prices. Accordingly, we have established a comprehensive risk
management process to monitor, evaluate and manage the principal exposures to which we believe we
are subject. We seek to manage these risks through the use of financial derivative instruments. Our
portfolio of derivative financial instruments may, from time to time, include forward foreign currency
exchange contracts, foreign currency options, interest rate swaps, commodity swaps and forward
commodity contracts. Derivative financial instruments related to interest rate sensitivity of debt
obligations, intercompany cross border transactions and anticipated non-functional currency cash flows
are used with the goal of mitigating a significant portion of these exposures when it is cost effective to
do so.
We do not execute transactions or utilize derivative financial instruments for trading or speculative
purposes. Further, to reduce the risk that a counterparty will be unable to honor its contractual
obligations to us, we only enter into contracts with counterparties having at least an Aǁ/A3 long-term
debt rating. These counterparties are generally financial institutions and there is no significant
concentration of exposure with any one party.
Foreign Currency Exposures
We hedge our exposure to fluctuations in foreign currency exchange rates through the use of
forward foreign currency exchange contracts. During 2011, our largest exposures to foreign exchange
rates existed primarily with the Swiss franc, British pound, Euro, Australian dollar and Canadian dollar
against the U.S. dollar. The market risk related to the forward foreign currency exchange contracts is
measured by estimating the potential impact of a 10% change in the value of the U.S. dollar relative to
the local currency exchange rates. The rates used to perform this analysis were based on the market
rates in effect on September 30, 2011. A 10% appreciation of the U.S. dollar relative to the local
currency exchange rates would result in a $32 million net decrease in the fair value of the contracts.
Conversely, a 10% depreciation of the U.S. dollar relative to the local currency exchange rates would
result in a $39 million net increase in the fair value of the contracts. However, gains or losses on these
derivative instruments are economically offset by the gains or losses on the underlying transactions.
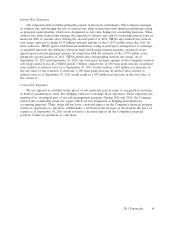
During the third quarter of 2010, Tyco International Finance, S.A. (‘‘TIFSA’’), the Company’s
finance subsidiary, entered into foreign currency exchange forward contracts to hedge its Euro
denominated net investment. The aggregate notional amount of these hedges was approximately
$224 million and $255 million as of September 30, 2011, and September 24, 2010, respectively. The
potential impact from a 10% appreciation of the U.S. dollar relative to the Euro would result in a
$19 million net increase in other comprehensive income. Conversely, a 10% depreciation of the U.S.
dollar relative to the Euro would result in a $24 million net decrease in other comprehensive income.
As of September 30, 2011, and September 24, 2010, $2.9 billion and $3.0 billion, respectively, of
intercompany loans have been designated as permanent in nature. For the fiscal years ended
September 30, 2011, September 24, 2010 and September 25, 2009, we recorded $16 million of
cumulative transaction gain, $24 million of cumulative translation loss and nil, respectively, through
accumulated other comprehensive loss related to these loans.
64 2011 Financials